29
/
en
AIzaSyAYiBZKx7MnpbEhh9jyipgxe19OcubqV5w
April 1, 2024
216692
Pakistan
PAK
true
2
1
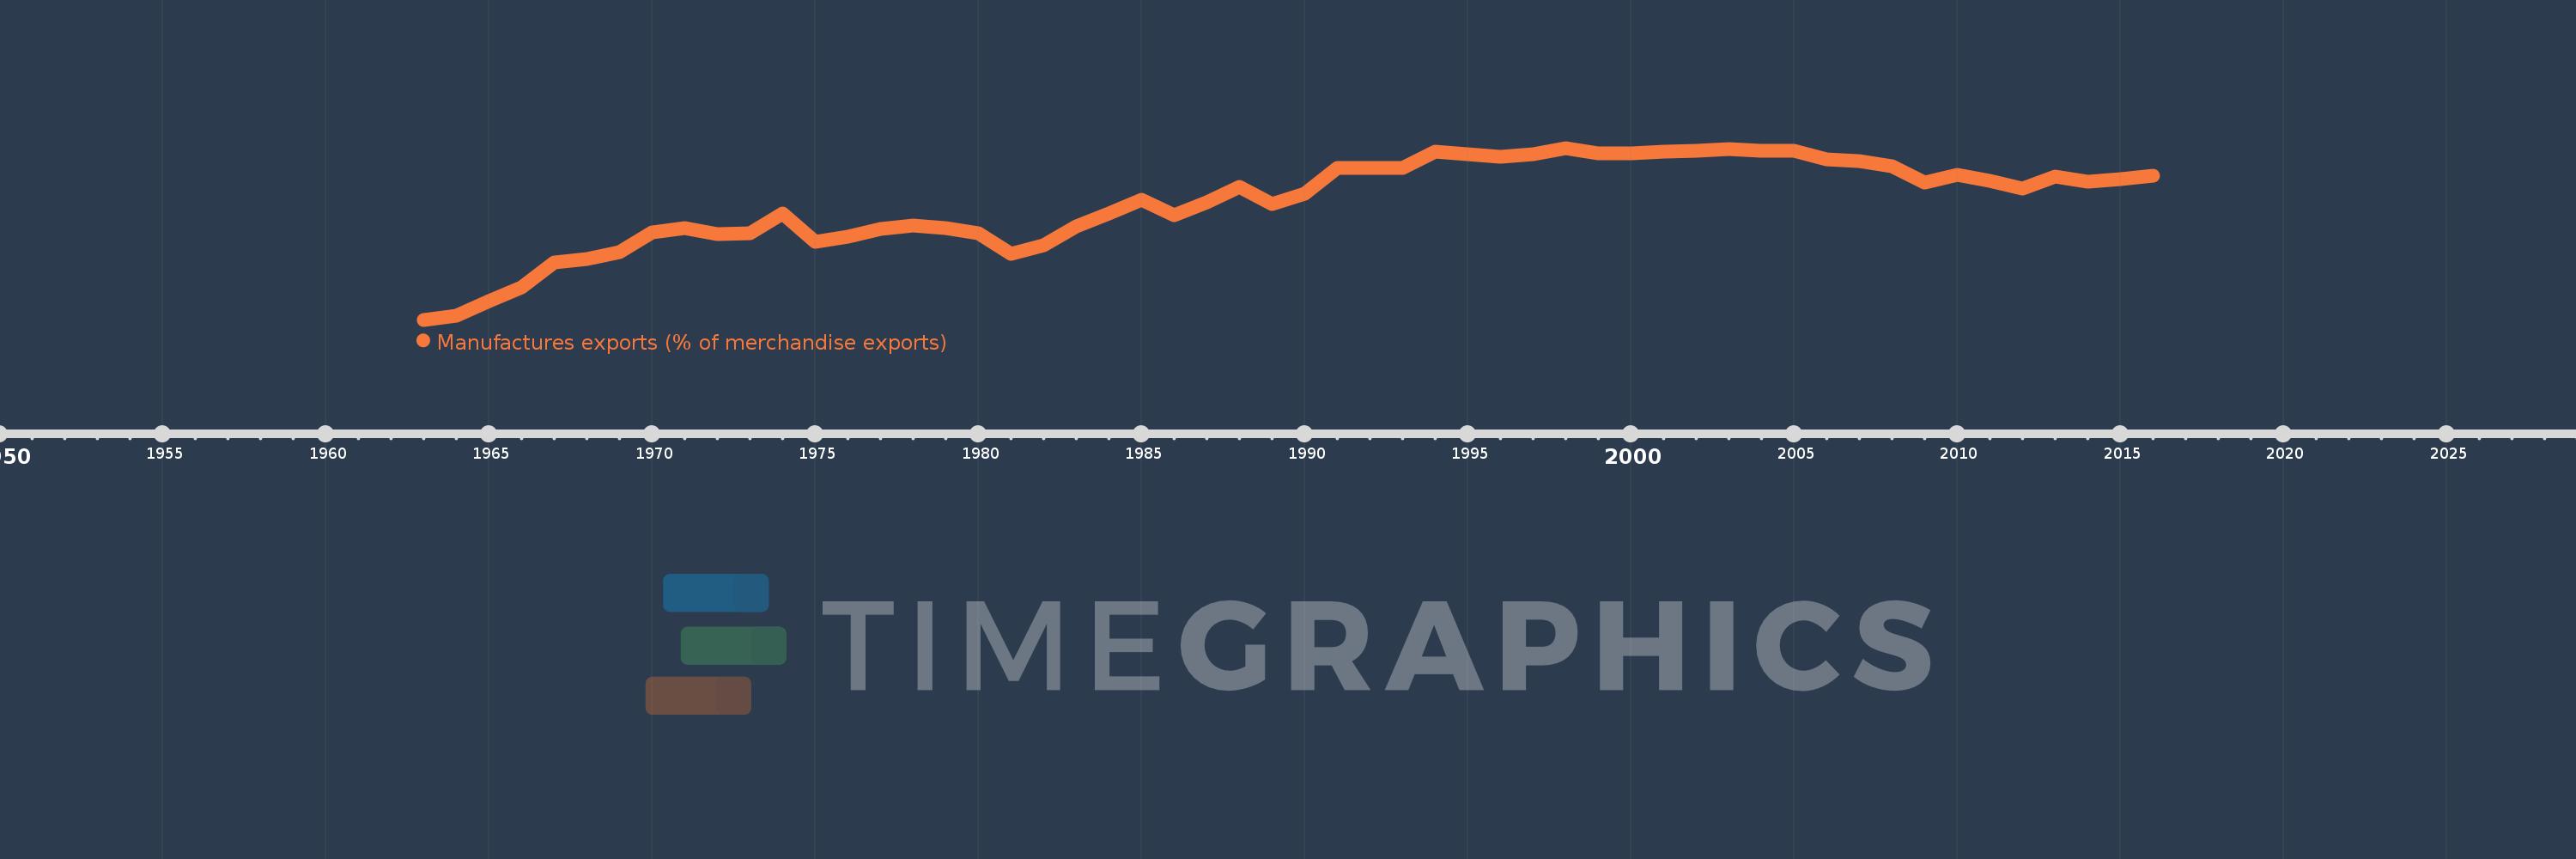
Manufactures exports (% of merchandise exports)
2016,2015,2014,2013,2012,2011,2010,2009,2008,2007,2006,2005,2004,2003,2002,2001,2000,1999,1998,1997,1996,1994,1993,1992,1991,1990,1989,1988,1987,1986,1985,1984,1983,1982,1981,1980,1979,1978,1977,1976,1975,1974,1973,1972,1971,1970,1969,1968,1967,1966,1965,1964,1963
This statistics in other country:
AfghanistanAlbaniaAlgeriaAndorraAngolaAntigua and BarbudaArab WorldArgentinaArmeniaArubaAustraliaAustriaAzerbaijanBahamas, TheBahrainBangladeshBarbadosBelarusBelgiumBelizeBeninBermudaBhutanBoliviaBosnia and HerzegovinaBotswanaBrazilBrunei DarussalamBulgariaBurkina FasoBurundiCabo VerdeCambodiaCameroonCanadaCaribbean small statesCayman IslandsCentral African RepublicCentral Europe and the BalticsChadChileChinaColombiaComorosCongo, Dem. Rep.Congo, Rep.Costa RicaCote d'IvoireCroatiaCubaCyprusCzech RepublicDenmarkDjiboutiDominicaDominican RepublicEarly-demographic dividendEast Asia & PacificEast Asia & Pacific (excluding high income)East Asia & Pacific (IDA & IBRD countries)EcuadorEgypt, Arab Rep.El SalvadorEquatorial GuineaEritreaEstoniaEthiopiaEuro areaEurope & Central AsiaEurope & Central Asia (excluding high income)Europe & Central Asia (IDA & IBRD countries)European UnionFaroe IslandsFijiFinlandFragile and conflict affected situationsFranceFrench PolynesiaGabonGambia, TheGeorgiaGermanyGhanaGreeceGreenlandGrenadaGuatemalaGuineaGuinea-BissauGuyanaHaitiHeavily indebted poor countries (HIPC)High incomeHondurasHong Kong SAR, ChinaHungaryIBRD onlyIcelandIDA & IBRD totalIDA blendIDA onlyIDA totalIndiaIndonesiaIran, Islamic Rep.IraqIrelandIsraelItalyJamaicaJapanJordanKazakhstanKenyaKiribatiKorea, Rep.KuwaitKyrgyz RepublicLao PDRLate-demographic dividendLatin America & Caribbean Latin America & Caribbean (excluding high income)Latin America & the Caribbean (IDA & IBRD countries)LatviaLeast developed countries: UN classificationLebanonLesothoLiberiaLibyaLithuaniaLow & middle incomeLower middle incomeLuxembourgMacao SAR, ChinaMacedonia, FYRMadagascarMalawiMalaysiaMaldivesMaliMaltaMauritaniaMauritiusMexicoMiddle East & North AfricaMiddle East & North Africa (excluding high income)Middle East & North Africa (IDA & IBRD countries)Middle incomeMoldovaMongoliaMoroccoMozambiqueMyanmarNamibiaNepalNetherlandsNew CaledoniaNew ZealandNicaraguaNigerNigeriaNorth AmericaNorwayOECD membersOmanOther small statesPacific island small statesPakistanPalauPanamaPapua New GuineaParaguayPeruPhilippinesPolandPortugalPost-demographic dividendPre-demographic dividendQatarRomaniaRussian FederationRwandaSamoaSao Tome and PrincipeSaudi ArabiaSenegalSerbiaSeychellesSierra LeoneSingaporeSlovak RepublicSloveniaSmall statesSolomon IslandsSomaliaSouth AfricaSouth AsiaSouth Asia (IDA & IBRD)SpainSri LankaSt. Kitts and NevisSt. LuciaSt. Vincent and the GrenadinesSub-Saharan Africa Sub-Saharan Africa (excluding high income)Sub-Saharan Africa (IDA & IBRD countries)SudanSurinameSwazilandSwedenSwitzerlandSyrian Arab RepublicTajikistanTanzaniaThailandTimor-LesteTogoTongaTrinidad and TobagoTunisiaTurkeyTurkmenistanTurks and Caicos IslandsTuvaluUgandaUkraineUnited Arab EmiratesUnited KingdomUnited StatesUpper middle incomeUruguayVanuatuVenezuela, RBVietnamVirgin Islands (U.S.)WorldYemen, Rep.ZambiaZimbabwe Timeline:
This timeline shows a graph from 1963 to 2016 of Pakistan. No data until 1962. Number of actual observations by date: 53.
Source name:
World Development Indicators
Source organization:
World Bank staff estimates from the Comtrade database maintained by the United Nations Statistics Division.
Categories, topics:
Private Sector, Trade
Last updated:
apr 23, 2017
Indicators value changes by year
Minimum:
24.465
jan 1, 1963
Maximum:
85.995
jan 1, 1998
At the date of observation
Value
Absolute change
Change from previous value
jan 1, 1963
24.465
+24.465
0.0%
jan 1, 1964
25.936
+1.471
6.01%
jan 1, 1965
31.053
+5.117
19.73%
jan 1, 1966
35.975
+4.922
15.85%
jan 1, 1967
44.919
+8.944
24.86%
jan 1, 1968
46.322
+1.404
3.12%
jan 1, 1969
48.629
+2.307
4.98%
jan 1, 1970
55.676
+7.047
14.49%
jan 1, 1971
57.187
+1.51
2.71%
jan 1, 1972
55.128
-2.059
-3.6%
jan 1, 1973
55.374
+0.246
0.45%
jan 1, 1974
62.374
+7.0
12.64%
jan 1, 1975
52.238
-10.136
-16.25%
jan 1, 1976
54.326
+2.089
4.0%
jan 1, 1977
57.019
+2.692
4.96%
jan 1, 1978
58.295
+1.277
2.24%
jan 1, 1979
57.26
-1.036
-1.78%
jan 1, 1980
55.423
-1.837
-3.21%
jan 1, 1981
48.191
-7.232
-13.05%
jan 1, 1982
51.096
+2.905
6.03%
jan 1, 1983
57.906
+6.81
13.33%
jan 1, 1984
62.507
+4.601
7.95%
jan 1, 1985
67.547
+5.04
8.06%
jan 1, 1986
61.89
-5.657
-8.37%
jan 1, 1987
66.391
+4.501
7.27%
jan 1, 1988
71.952
+5.561
8.38%
jan 1, 1989
66.015
-5.937
-8.25%
jan 1, 1990
69.686
+3.671
5.56%
jan 1, 1991
78.693
+9.007
12.92%
jan 1, 1992
78.913
+0.22
0.28%
jan 1, 1993
78.773
-0.14
-0.18%
jan 1, 1994
84.65
+5.877
7.46%
jan 1, 1996
82.966
-1.684
-1.99%
jan 1, 1997
83.784
+0.819
0.99%
jan 1, 1998
85.995
+2.21
2.64%
jan 1, 1999
83.911
-2.084
-2.42%
jan 1, 2000
84.15
+0.239
0.29%
jan 1, 2001
84.697
+0.547
0.65%
jan 1, 2002
84.876
+0.18
0.21%
jan 1, 2003
85.538
+0.661
0.78%
jan 1, 2004
84.959
-0.578
-0.68%
jan 1, 2005
84.956
-0.003
0.0%
jan 1, 2006
81.75
-3.206
-3.77%
jan 1, 2007
81.307
-0.442
-0.54%
jan 1, 2008
79.54
-1.767
-2.17%
jan 1, 2009
73.454
-6.086
-7.65%
jan 1, 2010
76.391
+2.938
4.0%
jan 1, 2011
74.09
-2.301
-3.01%
jan 1, 2012
71.505
-2.585
-3.49%
jan 1, 2013
75.806
+4.3
6.01%
jan 1, 2014
74.01
-1.796
-2.37%
jan 1, 2015
74.826
+0.816
1.1%
jan 1, 2016
76.096
+1.27
1.7%
Ranking of countries by current statistics by years


Comments: