29
/
en
AIzaSyAYiBZKx7MnpbEhh9jyipgxe19OcubqV5w
April 1, 2024
105120
Chile
CHL
true
2
1
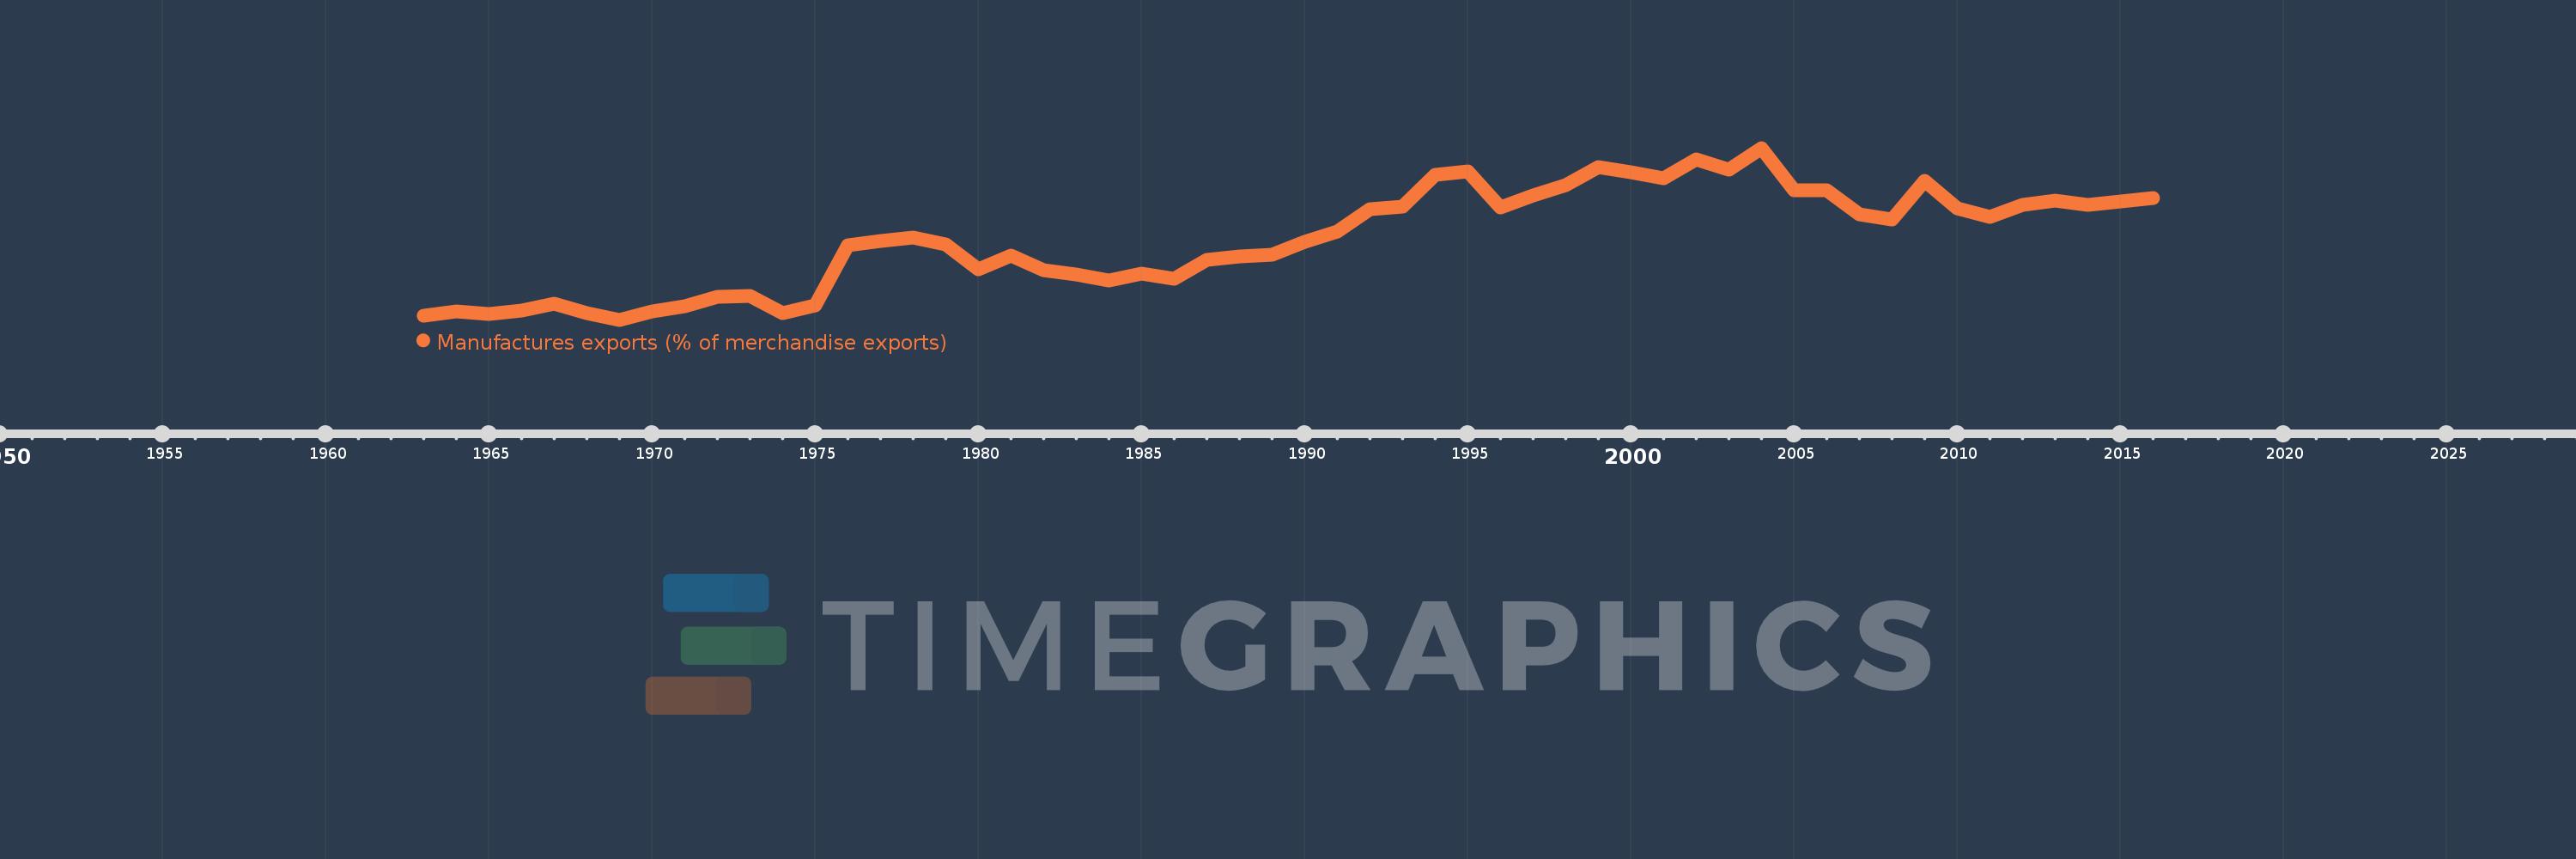
Manufactures exports (% of merchandise exports)
2016,2015,2014,2013,2012,2011,2010,2009,2008,2007,2006,2005,2004,2003,2002,2001,2000,1999,1998,1997,1996,1995,1994,1993,1992,1991,1990,1989,1988,1987,1986,1985,1984,1983,1982,1981,1980,1979,1978,1977,1976,1975,1974,1973,1972,1971,1970,1969,1968,1967,1966,1965,1964,1963
This statistics in other country:
AfghanistanAlbaniaAlgeriaAndorraAngolaAntigua and BarbudaArab WorldArgentinaArmeniaArubaAustraliaAustriaAzerbaijanBahamas, TheBahrainBangladeshBarbadosBelarusBelgiumBelizeBeninBermudaBhutanBoliviaBosnia and HerzegovinaBotswanaBrazilBrunei DarussalamBulgariaBurkina FasoBurundiCabo VerdeCambodiaCameroonCanadaCaribbean small statesCayman IslandsCentral African RepublicCentral Europe and the BalticsChadChileChinaColombiaComorosCongo, Dem. Rep.Congo, Rep.Costa RicaCote d'IvoireCroatiaCubaCyprusCzech RepublicDenmarkDjiboutiDominicaDominican RepublicEarly-demographic dividendEast Asia & PacificEast Asia & Pacific (excluding high income)East Asia & Pacific (IDA & IBRD countries)EcuadorEgypt, Arab Rep.El SalvadorEquatorial GuineaEritreaEstoniaEthiopiaEuro areaEurope & Central AsiaEurope & Central Asia (excluding high income)Europe & Central Asia (IDA & IBRD countries)European UnionFaroe IslandsFijiFinlandFragile and conflict affected situationsFranceFrench PolynesiaGabonGambia, TheGeorgiaGermanyGhanaGreeceGreenlandGrenadaGuatemalaGuineaGuinea-BissauGuyanaHaitiHeavily indebted poor countries (HIPC)High incomeHondurasHong Kong SAR, ChinaHungaryIBRD onlyIcelandIDA & IBRD totalIDA blendIDA onlyIDA totalIndiaIndonesiaIran, Islamic Rep.IraqIrelandIsraelItalyJamaicaJapanJordanKazakhstanKenyaKiribatiKorea, Rep.KuwaitKyrgyz RepublicLao PDRLate-demographic dividendLatin America & Caribbean Latin America & Caribbean (excluding high income)Latin America & the Caribbean (IDA & IBRD countries)LatviaLeast developed countries: UN classificationLebanonLesothoLiberiaLibyaLithuaniaLow & middle incomeLower middle incomeLuxembourgMacao SAR, ChinaMacedonia, FYRMadagascarMalawiMalaysiaMaldivesMaliMaltaMauritaniaMauritiusMexicoMiddle East & North AfricaMiddle East & North Africa (excluding high income)Middle East & North Africa (IDA & IBRD countries)Middle incomeMoldovaMongoliaMoroccoMozambiqueMyanmarNamibiaNepalNetherlandsNew CaledoniaNew ZealandNicaraguaNigerNigeriaNorth AmericaNorwayOECD membersOmanOther small statesPacific island small statesPakistanPalauPanamaPapua New GuineaParaguayPeruPhilippinesPolandPortugalPost-demographic dividendPre-demographic dividendQatarRomaniaRussian FederationRwandaSamoaSao Tome and PrincipeSaudi ArabiaSenegalSerbiaSeychellesSierra LeoneSingaporeSlovak RepublicSloveniaSmall statesSolomon IslandsSomaliaSouth AfricaSouth AsiaSouth Asia (IDA & IBRD)SpainSri LankaSt. Kitts and NevisSt. LuciaSt. Vincent and the GrenadinesSub-Saharan Africa Sub-Saharan Africa (excluding high income)Sub-Saharan Africa (IDA & IBRD countries)SudanSurinameSwazilandSwedenSwitzerlandSyrian Arab RepublicTajikistanTanzaniaThailandTimor-LesteTogoTongaTrinidad and TobagoTunisiaTurkeyTurkmenistanTurks and Caicos IslandsTuvaluUgandaUkraineUnited Arab EmiratesUnited KingdomUnited StatesUpper middle incomeUruguayVanuatuVenezuela, RBVietnamVirgin Islands (U.S.)WorldYemen, Rep.ZambiaZimbabwe Timeline:
This timeline shows a graph from 1963 to 2016 of Chile. No data until 1962. Number of actual observations by date: 54.
Source name:
World Development Indicators
Source organization:
World Bank staff estimates from the Comtrade database maintained by the United Nations Statistics Division.
Categories, topics:
Private Sector, Trade
Last updated:
apr 23, 2017
Indicators value changes by year
Maximum:
19.053
jan 1, 2004
At the date of observation
Value
Absolute change
Change from previous value
jan 1, 1963
3.469
+3.469
0.0%
jan 1, 1964
3.871
+0.402
11.59%
jan 1, 1965
3.618
-0.253
-6.54%
jan 1, 1966
3.918
+0.3
8.3%
jan 1, 1967
4.602
+0.684
17.46%
jan 1, 1968
3.671
-0.931
-20.24%
jan 1, 1969
3.09
-0.581
-15.82%
jan 1, 1970
3.848
+0.758
24.53%
jan 1, 1971
4.321
+0.473
12.3%
jan 1, 1972
5.248
+0.927
21.46%
jan 1, 1973
5.339
+0.091
1.73%
jan 1, 1974
3.672
-1.667
-31.22%
jan 1, 1975
4.405
+0.733
19.96%
jan 1, 1976
10.031
+5.626
127.71%
jan 1, 1977
10.428
+0.397
3.95%
jan 1, 1978
10.691
+0.263
2.52%
jan 1, 1979
10.11
-0.581
-5.43%
jan 1, 1980
7.768
-2.342
-23.17%
jan 1, 1981
9.092
+1.324
17.05%
jan 1, 1982
7.712
-1.38
-15.18%
jan 1, 1983
7.28
-0.432
-5.6%
jan 1, 1984
6.73
-0.55
-7.55%
jan 1, 1985
7.353
+0.623
9.25%
jan 1, 1986
6.866
-0.487
-6.62%
jan 1, 1987
8.645
+1.778
25.9%
jan 1, 1988
8.939
+0.295
3.41%
jan 1, 1989
9.138
+0.199
2.22%
jan 1, 1990
10.36
+1.222
13.37%
jan 1, 1991
11.252
+0.892
8.61%
jan 1, 1992
13.37
+2.118
18.82%
jan 1, 1993
13.606
+0.236
1.77%
jan 1, 1994
16.542
+2.936
21.58%
jan 1, 1995
16.861
+0.319
1.93%
jan 1, 1996
13.483
-3.377
-20.03%
jan 1, 1997
14.669
+1.185
8.79%
jan 1, 1998
15.563
+0.895
6.1%
jan 1, 1999
17.265
+1.702
10.93%
jan 1, 2000
16.815
-0.45
-2.61%
jan 1, 2001
16.24
-0.575
-3.42%
jan 1, 2002
18.007
+1.766
10.88%
jan 1, 2003
17.041
-0.966
-5.36%
jan 1, 2004
19.053
+2.012
11.81%
jan 1, 2005
15.118
-3.935
-20.65%
jan 1, 2006
15.09
-0.028
-0.18%
jan 1, 2007
12.849
-2.241
-14.85%
jan 1, 2008
12.393
-0.457
-3.56%
jan 1, 2009
15.965
+3.572
28.83%
jan 1, 2010
13.434
-2.531
-15.85%
jan 1, 2011
12.645
-0.789
-5.87%
jan 1, 2012
13.772
+1.127
8.91%
jan 1, 2013
14.193
+0.422
3.06%
jan 1, 2014
13.729
-0.465
-3.27%
jan 1, 2015
14.119
+0.39
2.84%
jan 1, 2016
14.416
+0.298
2.11%
Ranking of countries by current statistics by years


Comments: