29
/
en
AIzaSyAYiBZKx7MnpbEhh9jyipgxe19OcubqV5w
April 1, 2024
41646
Latin America & Caribbean
LCN
false
2
1
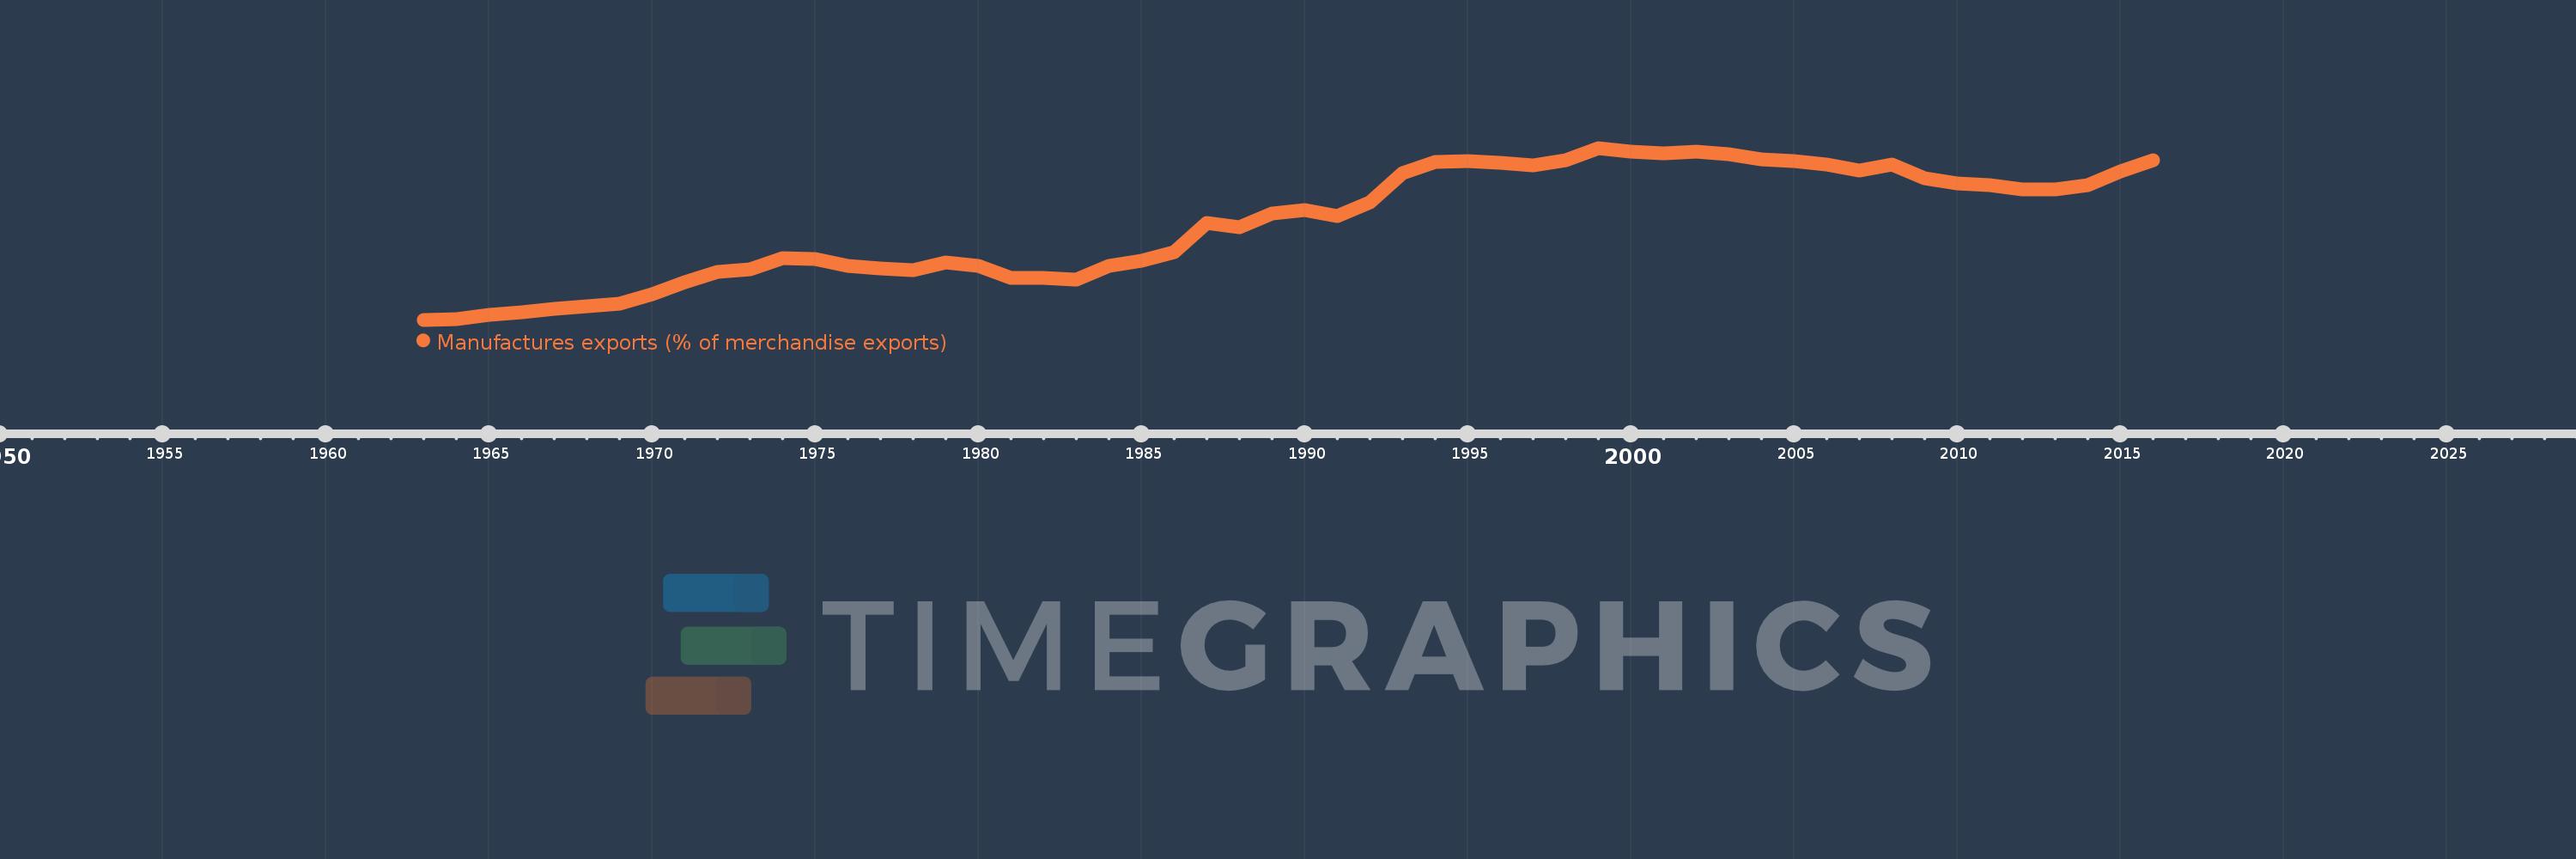
Manufactures exports (% of merchandise exports)
2016,2015,2014,2013,2012,2011,2010,2009,2008,2007,2006,2005,2004,2003,2002,2001,2000,1999,1998,1997,1996,1995,1994,1993,1992,1991,1990,1989,1988,1987,1986,1985,1984,1983,1982,1981,1980,1979,1978,1977,1976,1975,1974,1973,1972,1971,1970,1969,1968,1967,1966,1965,1964,1963
This statistics in other country:
AfghanistanAlbaniaAlgeriaAndorraAngolaAntigua and BarbudaArab WorldArgentinaArmeniaArubaAustraliaAustriaAzerbaijanBahamas, TheBahrainBangladeshBarbadosBelarusBelgiumBelizeBeninBermudaBhutanBoliviaBosnia and HerzegovinaBotswanaBrazilBrunei DarussalamBulgariaBurkina FasoBurundiCabo VerdeCambodiaCameroonCanadaCaribbean small statesCayman IslandsCentral African RepublicCentral Europe and the BalticsChadChileChinaColombiaComorosCongo, Dem. Rep.Congo, Rep.Costa RicaCote d'IvoireCroatiaCubaCyprusCzech RepublicDenmarkDjiboutiDominicaDominican RepublicEarly-demographic dividendEast Asia & PacificEast Asia & Pacific (excluding high income)East Asia & Pacific (IDA & IBRD countries)EcuadorEgypt, Arab Rep.El SalvadorEquatorial GuineaEritreaEstoniaEthiopiaEuro areaEurope & Central AsiaEurope & Central Asia (excluding high income)Europe & Central Asia (IDA & IBRD countries)European UnionFaroe IslandsFijiFinlandFragile and conflict affected situationsFranceFrench PolynesiaGabonGambia, TheGeorgiaGermanyGhanaGreeceGreenlandGrenadaGuatemalaGuineaGuinea-BissauGuyanaHaitiHeavily indebted poor countries (HIPC)High incomeHondurasHong Kong SAR, ChinaHungaryIBRD onlyIcelandIDA & IBRD totalIDA blendIDA onlyIDA totalIndiaIndonesiaIran, Islamic Rep.IraqIrelandIsraelItalyJamaicaJapanJordanKazakhstanKenyaKiribatiKorea, Rep.KuwaitKyrgyz RepublicLao PDRLate-demographic dividendLatin America & Caribbean Latin America & Caribbean (excluding high income)Latin America & the Caribbean (IDA & IBRD countries)LatviaLeast developed countries: UN classificationLebanonLesothoLiberiaLibyaLithuaniaLow & middle incomeLower middle incomeLuxembourgMacao SAR, ChinaMacedonia, FYRMadagascarMalawiMalaysiaMaldivesMaliMaltaMauritaniaMauritiusMexicoMiddle East & North AfricaMiddle East & North Africa (excluding high income)Middle East & North Africa (IDA & IBRD countries)Middle incomeMoldovaMongoliaMoroccoMozambiqueMyanmarNamibiaNepalNetherlandsNew CaledoniaNew ZealandNicaraguaNigerNigeriaNorth AmericaNorwayOECD membersOmanOther small statesPacific island small statesPakistanPalauPanamaPapua New GuineaParaguayPeruPhilippinesPolandPortugalPost-demographic dividendPre-demographic dividendQatarRomaniaRussian FederationRwandaSamoaSao Tome and PrincipeSaudi ArabiaSenegalSerbiaSeychellesSierra LeoneSingaporeSlovak RepublicSloveniaSmall statesSolomon IslandsSomaliaSouth AfricaSouth AsiaSouth Asia (IDA & IBRD)SpainSri LankaSt. Kitts and NevisSt. LuciaSt. Vincent and the GrenadinesSub-Saharan Africa Sub-Saharan Africa (excluding high income)Sub-Saharan Africa (IDA & IBRD countries)SudanSurinameSwazilandSwedenSwitzerlandSyrian Arab RepublicTajikistanTanzaniaThailandTimor-LesteTogoTongaTrinidad and TobagoTunisiaTurkeyTurkmenistanTurks and Caicos IslandsTuvaluUgandaUkraineUnited Arab EmiratesUnited KingdomUnited StatesUpper middle incomeUruguayVanuatuVenezuela, RBVietnamVirgin Islands (U.S.)WorldYemen, Rep.ZambiaZimbabwe Timeline:
This timeline shows a graph from 1963 to 2016 of Latin America & Caribbean . No data until 1962. Number of actual observations by date: 54.
Source name:
World Development Indicators
Source organization:
World Bank staff estimates from the Comtrade database maintained by the United Nations Statistics Division.
Categories, topics:
Private Sector, Trade
Last updated:
apr 23, 2017
Indicators value changes by year
Maximum:
52.619
jan 1, 1999
At the date of observation
Value
Absolute change
Change from previous value
jan 1, 1963
7.451
+7.451
0.0%
jan 1, 1964
7.586
+0.136
1.82%
jan 1, 1965
8.726
+1.14
15.02%
jan 1, 1966
9.342
+0.616
7.06%
jan 1, 1967
10.388
+1.046
11.19%
jan 1, 1968
11.056
+0.668
6.43%
jan 1, 1969
11.637
+0.581
5.26%
jan 1, 1970
14.106
+2.469
21.21%
jan 1, 1971
17.357
+3.251
23.05%
jan 1, 1972
20.027
+2.67
15.38%
jan 1, 1973
20.66
+0.633
3.16%
jan 1, 1974
23.585
+2.925
14.16%
jan 1, 1975
23.515
-0.07
-0.3%
jan 1, 1976
21.627
-1.888
-8.03%
jan 1, 1977
20.823
-0.804
-3.72%
jan 1, 1978
20.503
-0.32
-1.54%
jan 1, 1979
22.462
+1.959
9.55%
jan 1, 1980
21.61
-0.852
-3.79%
jan 1, 1981
18.534
-3.076
-14.23%
jan 1, 1982
18.525
-0.009
-0.05%
jan 1, 1983
17.962
-0.563
-3.04%
jan 1, 1984
21.658
+3.696
20.57%
jan 1, 1985
22.933
+1.275
5.89%
jan 1, 1986
25.175
+2.242
9.78%
jan 1, 1987
32.96
+7.785
30.92%
jan 1, 1988
31.72
-1.24
-3.76%
jan 1, 1989
35.304
+3.583
11.3%
jan 1, 1990
36.357
+1.053
2.98%
jan 1, 1991
34.809
-1.548
-4.26%
jan 1, 1992
38.401
+3.592
10.32%
jan 1, 1993
46.087
+7.686
20.02%
jan 1, 1994
48.987
+2.9
6.29%
jan 1, 1995
49.242
+0.255
0.52%
jan 1, 1996
48.68
-0.562
-1.14%
jan 1, 1997
48.059
-0.621
-1.28%
jan 1, 1998
49.491
+1.432
2.98%
jan 1, 1999
52.619
+3.128
6.32%
jan 1, 2000
51.583
-1.036
-1.97%
jan 1, 2001
51.271
-0.311
-0.6%
jan 1, 2002
51.658
+0.386
0.75%
jan 1, 2003
50.861
-0.797
-1.54%
jan 1, 2004
49.666
-1.195
-2.35%
jan 1, 2005
49.233
-0.433
-0.87%
jan 1, 2006
48.246
-0.987
-2.0%
jan 1, 2007
46.739
-1.507
-3.12%
jan 1, 2008
48.204
+1.464
3.13%
jan 1, 2009
44.747
-3.456
-7.17%
jan 1, 2010
43.373
-1.374
-3.07%
jan 1, 2011
42.863
-0.51
-1.17%
jan 1, 2012
41.636
-1.227
-2.86%
jan 1, 2013
41.768
+0.132
0.32%
jan 1, 2014
42.789
+1.021
2.44%
jan 1, 2015
46.438
+3.649
8.53%
jan 1, 2016
49.315
+2.877
6.19%
Ranking of countries by current statistics by years


Comments: