29
/
en
AIzaSyAYiBZKx7MnpbEhh9jyipgxe19OcubqV5w
April 1, 2024
253267
Sudan
SDN
true
2
1
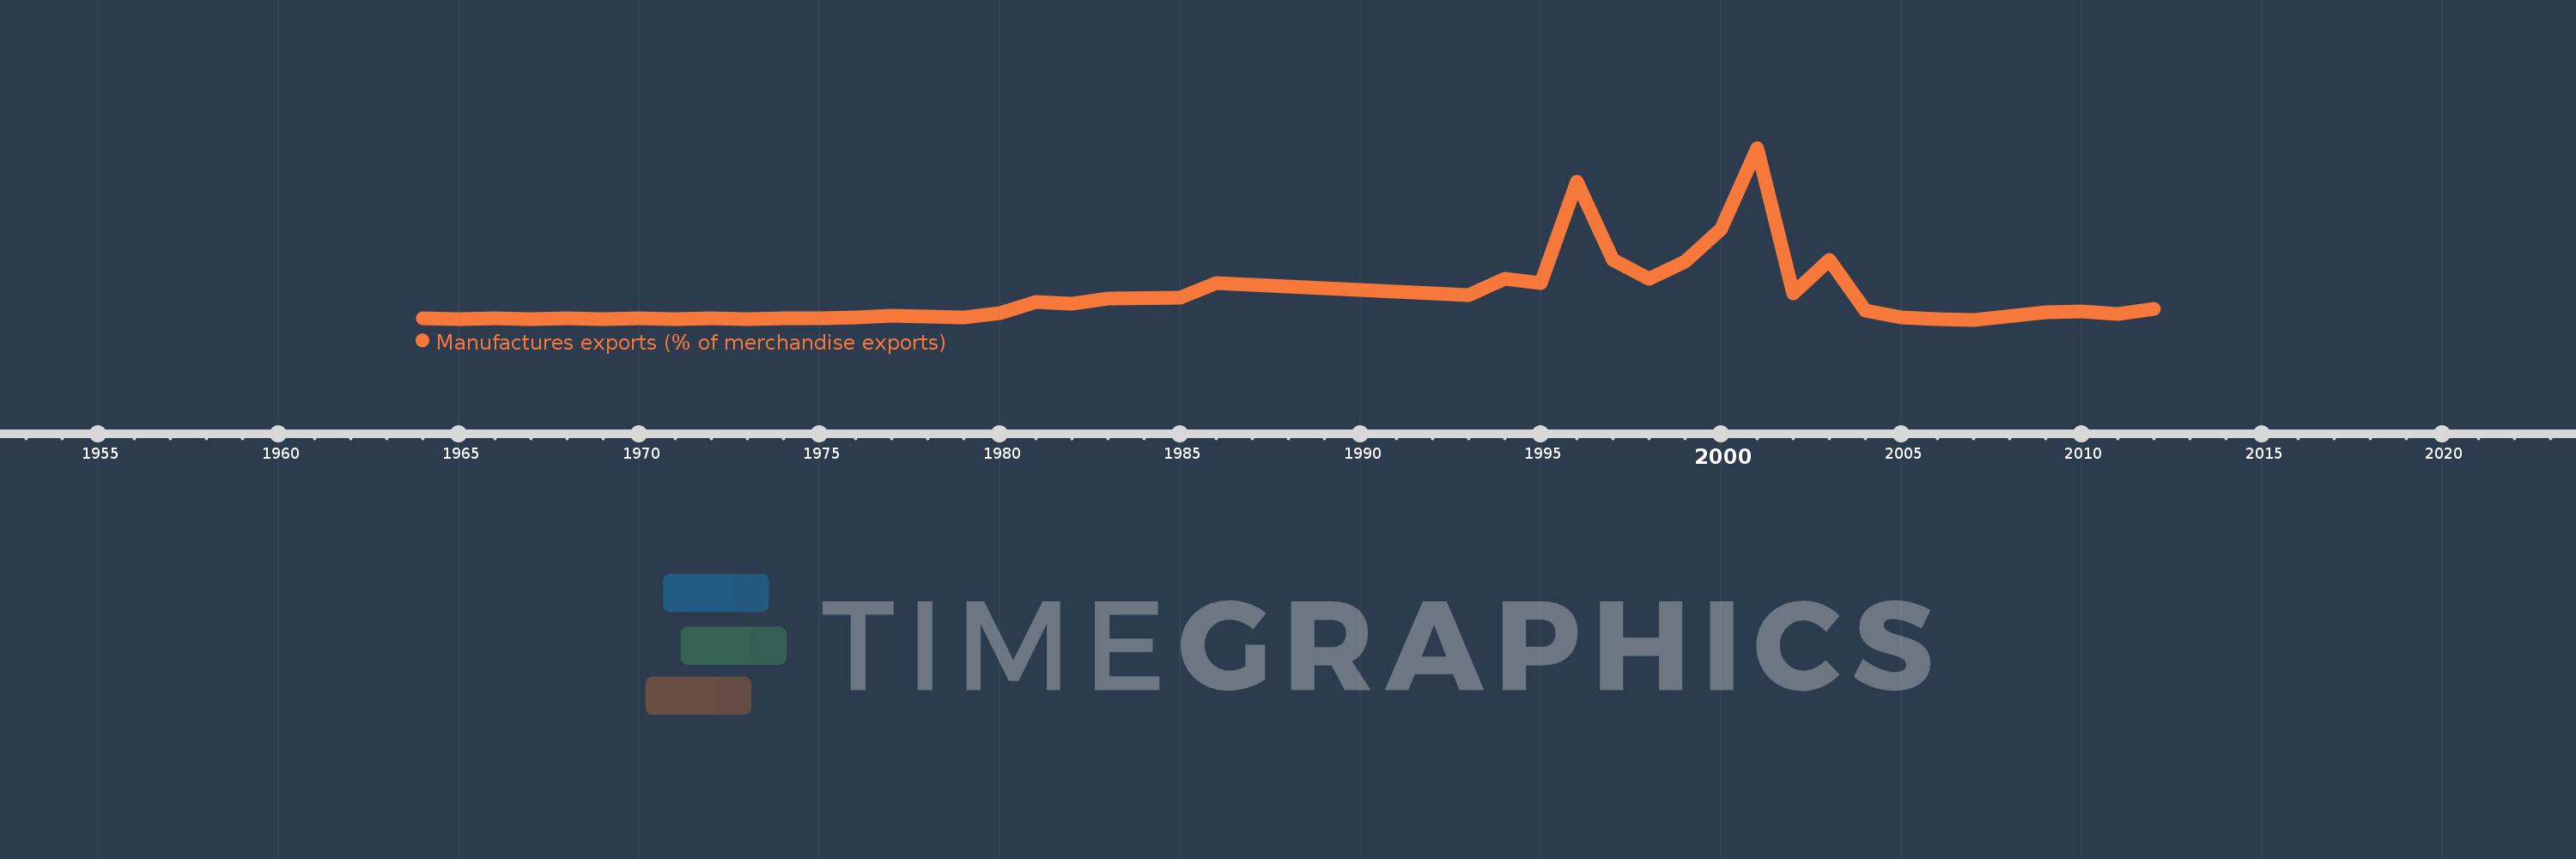
Manufactures exports (% of merchandise exports)
2012,2011,2010,2009,2007,2006,2005,2004,2003,2002,2001,2000,1999,1998,1997,1996,1995,1994,1993,1986,1985,1983,1982,1981,1980,1979,1977,1976,1975,1974,1973,1972,1971,1970,1969,1968,1967,1966,1965,1964
This statistics in other country:
AfghanistanAlbaniaAlgeriaAndorraAngolaAntigua and BarbudaArab WorldArgentinaArmeniaArubaAustraliaAustriaAzerbaijanBahamas, TheBahrainBangladeshBarbadosBelarusBelgiumBelizeBeninBermudaBhutanBoliviaBosnia and HerzegovinaBotswanaBrazilBrunei DarussalamBulgariaBurkina FasoBurundiCabo VerdeCambodiaCameroonCanadaCaribbean small statesCayman IslandsCentral African RepublicCentral Europe and the BalticsChadChileChinaColombiaComorosCongo, Dem. Rep.Congo, Rep.Costa RicaCote d'IvoireCroatiaCubaCyprusCzech RepublicDenmarkDjiboutiDominicaDominican RepublicEarly-demographic dividendEast Asia & PacificEast Asia & Pacific (excluding high income)East Asia & Pacific (IDA & IBRD countries)EcuadorEgypt, Arab Rep.El SalvadorEquatorial GuineaEritreaEstoniaEthiopiaEuro areaEurope & Central AsiaEurope & Central Asia (excluding high income)Europe & Central Asia (IDA & IBRD countries)European UnionFaroe IslandsFijiFinlandFragile and conflict affected situationsFranceFrench PolynesiaGabonGambia, TheGeorgiaGermanyGhanaGreeceGreenlandGrenadaGuatemalaGuineaGuinea-BissauGuyanaHaitiHeavily indebted poor countries (HIPC)High incomeHondurasHong Kong SAR, ChinaHungaryIBRD onlyIcelandIDA & IBRD totalIDA blendIDA onlyIDA totalIndiaIndonesiaIran, Islamic Rep.IraqIrelandIsraelItalyJamaicaJapanJordanKazakhstanKenyaKiribatiKorea, Rep.KuwaitKyrgyz RepublicLao PDRLate-demographic dividendLatin America & Caribbean Latin America & Caribbean (excluding high income)Latin America & the Caribbean (IDA & IBRD countries)LatviaLeast developed countries: UN classificationLebanonLesothoLiberiaLibyaLithuaniaLow & middle incomeLower middle incomeLuxembourgMacao SAR, ChinaMacedonia, FYRMadagascarMalawiMalaysiaMaldivesMaliMaltaMauritaniaMauritiusMexicoMiddle East & North AfricaMiddle East & North Africa (excluding high income)Middle East & North Africa (IDA & IBRD countries)Middle incomeMoldovaMongoliaMoroccoMozambiqueMyanmarNamibiaNepalNetherlandsNew CaledoniaNew ZealandNicaraguaNigerNigeriaNorth AmericaNorwayOECD membersOmanOther small statesPacific island small statesPakistanPalauPanamaPapua New GuineaParaguayPeruPhilippinesPolandPortugalPost-demographic dividendPre-demographic dividendQatarRomaniaRussian FederationRwandaSamoaSao Tome and PrincipeSaudi ArabiaSenegalSerbiaSeychellesSierra LeoneSingaporeSlovak RepublicSloveniaSmall statesSolomon IslandsSomaliaSouth AfricaSouth AsiaSouth Asia (IDA & IBRD)SpainSri LankaSt. Kitts and NevisSt. LuciaSt. Vincent and the GrenadinesSub-Saharan Africa Sub-Saharan Africa (excluding high income)Sub-Saharan Africa (IDA & IBRD countries)SudanSurinameSwazilandSwedenSwitzerlandSyrian Arab RepublicTajikistanTanzaniaThailandTimor-LesteTogoTongaTrinidad and TobagoTunisiaTurkeyTurkmenistanTurks and Caicos IslandsTuvaluUgandaUkraineUnited Arab EmiratesUnited KingdomUnited StatesUpper middle incomeUruguayVanuatuVenezuela, RBVietnamVirgin Islands (U.S.)WorldYemen, Rep.ZambiaZimbabwe Timeline:
This timeline shows a graph from 1964 to 2012 of Sudan. No data until 1963. Number of actual observations by date: 40.
Source name:
World Development Indicators
Source organization:
World Bank staff estimates from the Comtrade database maintained by the United Nations Statistics Division.
Categories, topics:
Private Sector, Trade
Last updated:
apr 23, 2017
Indicators value changes by year
At the date of observation
Value
Absolute change
Change from previous value
jan 1, 1964
0.086
+0.086
0.0%
jan 1, 1965
0.075
-0.011
-12.82%
jan 1, 1966
0.1
+0.026
34.08%
jan 1, 1967
0.069
-0.031
-30.87%
jan 1, 1968
0.086
+0.017
24.43%
jan 1, 1969
0.074
-0.012
-14.28%
jan 1, 1970
0.092
+0.018
24.82%
jan 1, 1971
0.07
-0.022
-24.02%
jan 1, 1972
0.076
+0.006
8.07%
jan 1, 1973
0.057
-0.018
-24.19%
jan 1, 1974
0.089
+0.031
54.28%
jan 1, 1975
0.079
-0.01
-10.94%
jan 1, 1976
0.134
+0.055
69.86%
jan 1, 1977
0.226
+0.092
68.52%
jan 1, 1979
0.118
-0.108
-47.7%
jan 1, 1980
0.323
+0.205
173.03%
jan 1, 1981
0.849
+0.526
162.78%
jan 1, 1982
0.764
-0.085
-10.01%
jan 1, 1983
0.986
+0.223
29.14%
jan 1, 1985
1.054
+0.068
6.88%
jan 1, 1986
1.72
+0.666
63.17%
jan 1, 1993
1.167
-0.553
-32.16%
jan 1, 1994
1.881
+0.714
61.19%
jan 1, 1995
1.7
-0.181
-9.62%
jan 1, 1996
6.326
+4.626
272.17%
jan 1, 1997
2.764
-3.562
-56.3%
jan 1, 1998
1.904
-0.86
-31.12%
jan 1, 1999
2.671
+0.767
40.28%
jan 1, 2000
4.161
+1.491
55.82%
jan 1, 2001
7.874
+3.713
89.23%
jan 1, 2002
1.248
-6.627
-84.15%
jan 1, 2003
2.765
+1.517
121.58%
jan 1, 2004
0.441
-2.324
-84.04%
jan 1, 2005
0.125
-0.317
-71.78%
jan 1, 2006
0.058
-0.067
-53.6%
jan 1, 2007
0.028
-0.03
-52.4%
jan 1, 2009
0.365
+0.337
1.23K%
jan 1, 2010
0.422
+0.057
15.73%
jan 1, 2011
0.307
-0.115
-27.2%
jan 1, 2012
0.52
+0.212
69.03%
Ranking of countries by current statistics by years


Comments: