29
/
en
AIzaSyAYiBZKx7MnpbEhh9jyipgxe19OcubqV5w
April 1, 2024
154872
India
IND
true
2
1
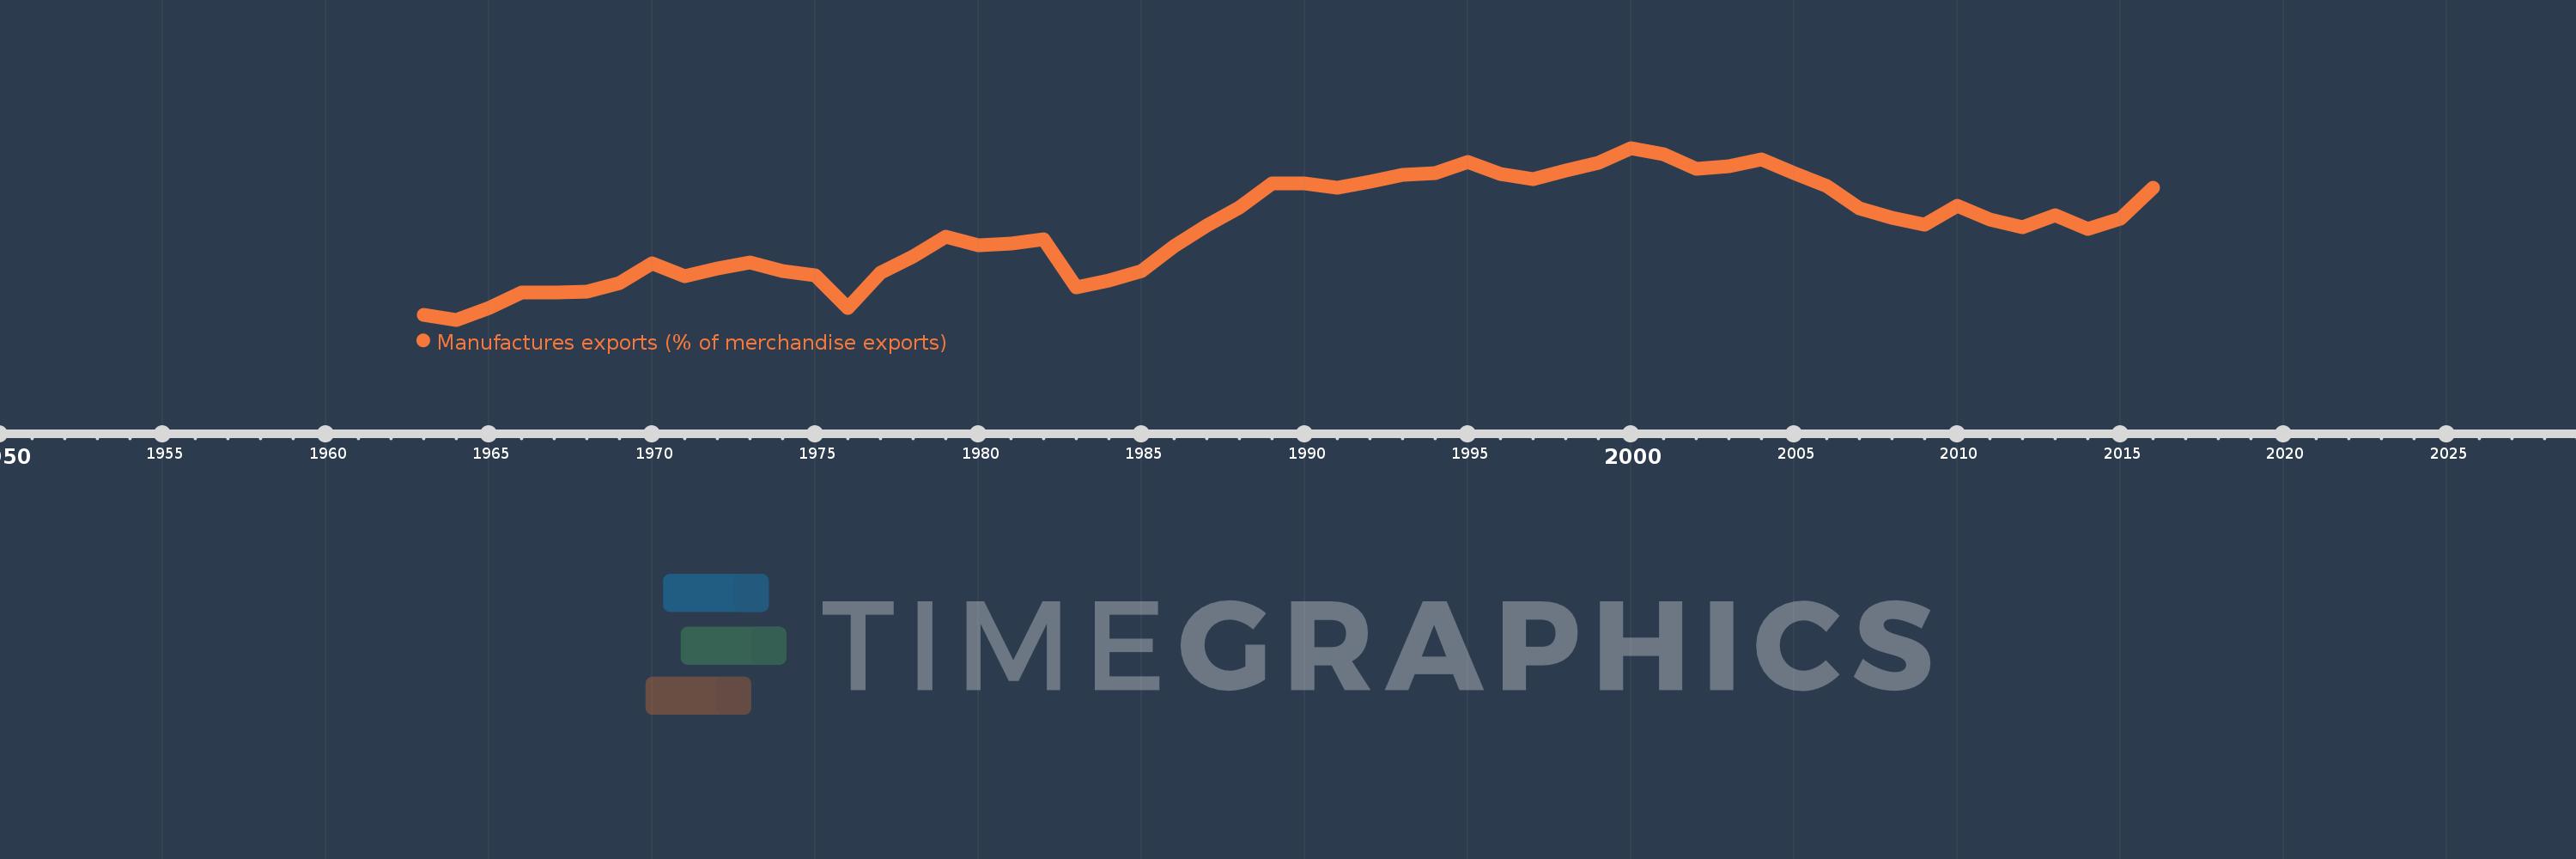
Manufactures exports (% of merchandise exports)
2016,2015,2014,2013,2012,2011,2010,2009,2008,2007,2006,2005,2004,2003,2002,2001,2000,1999,1998,1997,1996,1995,1994,1993,1992,1991,1990,1989,1988,1987,1986,1985,1984,1983,1982,1981,1980,1979,1978,1977,1976,1975,1974,1973,1972,1971,1970,1969,1968,1967,1966,1965,1964,1963
This statistics in other country:
AfghanistanAlbaniaAlgeriaAndorraAngolaAntigua and BarbudaArab WorldArgentinaArmeniaArubaAustraliaAustriaAzerbaijanBahamas, TheBahrainBangladeshBarbadosBelarusBelgiumBelizeBeninBermudaBhutanBoliviaBosnia and HerzegovinaBotswanaBrazilBrunei DarussalamBulgariaBurkina FasoBurundiCabo VerdeCambodiaCameroonCanadaCaribbean small statesCayman IslandsCentral African RepublicCentral Europe and the BalticsChadChileChinaColombiaComorosCongo, Dem. Rep.Congo, Rep.Costa RicaCote d'IvoireCroatiaCubaCyprusCzech RepublicDenmarkDjiboutiDominicaDominican RepublicEarly-demographic dividendEast Asia & PacificEast Asia & Pacific (excluding high income)East Asia & Pacific (IDA & IBRD countries)EcuadorEgypt, Arab Rep.El SalvadorEquatorial GuineaEritreaEstoniaEthiopiaEuro areaEurope & Central AsiaEurope & Central Asia (excluding high income)Europe & Central Asia (IDA & IBRD countries)European UnionFaroe IslandsFijiFinlandFragile and conflict affected situationsFranceFrench PolynesiaGabonGambia, TheGeorgiaGermanyGhanaGreeceGreenlandGrenadaGuatemalaGuineaGuinea-BissauGuyanaHaitiHeavily indebted poor countries (HIPC)High incomeHondurasHong Kong SAR, ChinaHungaryIBRD onlyIcelandIDA & IBRD totalIDA blendIDA onlyIDA totalIndiaIndonesiaIran, Islamic Rep.IraqIrelandIsraelItalyJamaicaJapanJordanKazakhstanKenyaKiribatiKorea, Rep.KuwaitKyrgyz RepublicLao PDRLate-demographic dividendLatin America & Caribbean Latin America & Caribbean (excluding high income)Latin America & the Caribbean (IDA & IBRD countries)LatviaLeast developed countries: UN classificationLebanonLesothoLiberiaLibyaLithuaniaLow & middle incomeLower middle incomeLuxembourgMacao SAR, ChinaMacedonia, FYRMadagascarMalawiMalaysiaMaldivesMaliMaltaMauritaniaMauritiusMexicoMiddle East & North AfricaMiddle East & North Africa (excluding high income)Middle East & North Africa (IDA & IBRD countries)Middle incomeMoldovaMongoliaMoroccoMozambiqueMyanmarNamibiaNepalNetherlandsNew CaledoniaNew ZealandNicaraguaNigerNigeriaNorth AmericaNorwayOECD membersOmanOther small statesPacific island small statesPakistanPalauPanamaPapua New GuineaParaguayPeruPhilippinesPolandPortugalPost-demographic dividendPre-demographic dividendQatarRomaniaRussian FederationRwandaSamoaSao Tome and PrincipeSaudi ArabiaSenegalSerbiaSeychellesSierra LeoneSingaporeSlovak RepublicSloveniaSmall statesSolomon IslandsSomaliaSouth AfricaSouth AsiaSouth Asia (IDA & IBRD)SpainSri LankaSt. Kitts and NevisSt. LuciaSt. Vincent and the GrenadinesSub-Saharan Africa Sub-Saharan Africa (excluding high income)Sub-Saharan Africa (IDA & IBRD countries)SudanSurinameSwazilandSwedenSwitzerlandSyrian Arab RepublicTajikistanTanzaniaThailandTimor-LesteTogoTongaTrinidad and TobagoTunisiaTurkeyTurkmenistanTurks and Caicos IslandsTuvaluUgandaUkraineUnited Arab EmiratesUnited KingdomUnited StatesUpper middle incomeUruguayVanuatuVenezuela, RBVietnamVirgin Islands (U.S.)WorldYemen, Rep.ZambiaZimbabwe Timeline:
This timeline shows a graph from 1963 to 2016 of India. No data until 1962. Number of actual observations by date: 54.
Source name:
World Development Indicators
Source organization:
World Bank staff estimates from the Comtrade database maintained by the United Nations Statistics Division.
Categories, topics:
Private Sector, Trade
Last updated:
apr 23, 2017
Indicators value changes by year
Minimum:
42.329
jan 1, 1964
Maximum:
79.203
jan 1, 2000
At the date of observation
Value
Absolute change
Change from previous value
jan 1, 1963
43.434
+43.434
0.0%
jan 1, 1964
42.329
-1.105
-2.54%
jan 1, 1965
44.808
+2.478
5.86%
jan 1, 1966
48.237
+3.429
7.65%
jan 1, 1967
48.257
+0.02
0.04%
jan 1, 1968
48.271
+0.014
0.03%
jan 1, 1969
50.289
+2.018
4.18%
jan 1, 1970
54.441
+4.153
8.26%
jan 1, 1971
51.684
-2.758
-5.07%
jan 1, 1972
53.395
+1.712
3.31%
jan 1, 1973
54.671
+1.276
2.39%
jan 1, 1974
52.709
-1.963
-3.59%
jan 1, 1975
51.943
-0.766
-1.45%
jan 1, 1976
44.86
-7.083
-13.64%
jan 1, 1977
52.452
+7.592
16.92%
jan 1, 1978
55.917
+3.465
6.61%
jan 1, 1979
60.209
+4.292
7.68%
jan 1, 1980
58.39
-1.82
-3.02%
jan 1, 1981
58.641
+0.251
0.43%
jan 1, 1982
59.517
+0.876
1.49%
jan 1, 1983
49.192
-10.325
-17.35%
jan 1, 1984
50.669
+1.477
3.0%
jan 1, 1985
52.834
+2.165
4.27%
jan 1, 1986
58.106
+5.272
9.98%
jan 1, 1987
62.544
+4.437
7.64%
jan 1, 1988
66.422
+3.878
6.2%
jan 1, 1989
71.545
+5.123
7.71%
jan 1, 1990
71.663
+0.118
0.17%
jan 1, 1991
70.688
-0.974
-1.36%
jan 1, 1992
72.039
+1.35
1.91%
jan 1, 1993
73.516
+1.477
2.05%
jan 1, 1994
73.75
+0.234
0.32%
jan 1, 1995
76.218
+2.467
3.35%
jan 1, 1996
73.546
-2.671
-3.5%
jan 1, 1997
72.422
-1.125
-1.53%
jan 1, 1998
74.264
+1.842
2.54%
jan 1, 1999
76.042
+1.778
2.39%
jan 1, 2000
79.203
+3.162
4.16%
jan 1, 2001
77.838
-1.366
-1.72%
jan 1, 2002
74.761
-3.076
-3.95%
jan 1, 2003
75.317
+0.556
0.74%
jan 1, 2004
76.761
+1.444
1.92%
jan 1, 2005
73.712
-3.049
-3.97%
jan 1, 2006
71.074
-2.637
-3.58%
jan 1, 2007
66.257
-4.817
-6.78%
jan 1, 2008
64.203
-2.054
-3.1%
jan 1, 2009
62.783
-1.419
-2.21%
jan 1, 2010
66.817
+4.033
6.42%
jan 1, 2011
63.764
-3.053
-4.57%
jan 1, 2012
62.226
-1.538
-2.41%
jan 1, 2013
64.771
+2.545
4.09%
jan 1, 2014
61.877
-2.894
-4.47%
jan 1, 2015
64.006
+2.129
3.44%
jan 1, 2016
70.603
+6.597
10.31%
Ranking of countries by current statistics by years


Comments: