29
/
en
AIzaSyAYiBZKx7MnpbEhh9jyipgxe19OcubqV5w
April 1, 2024
61803
Upper middle income
UMC
false
2
1
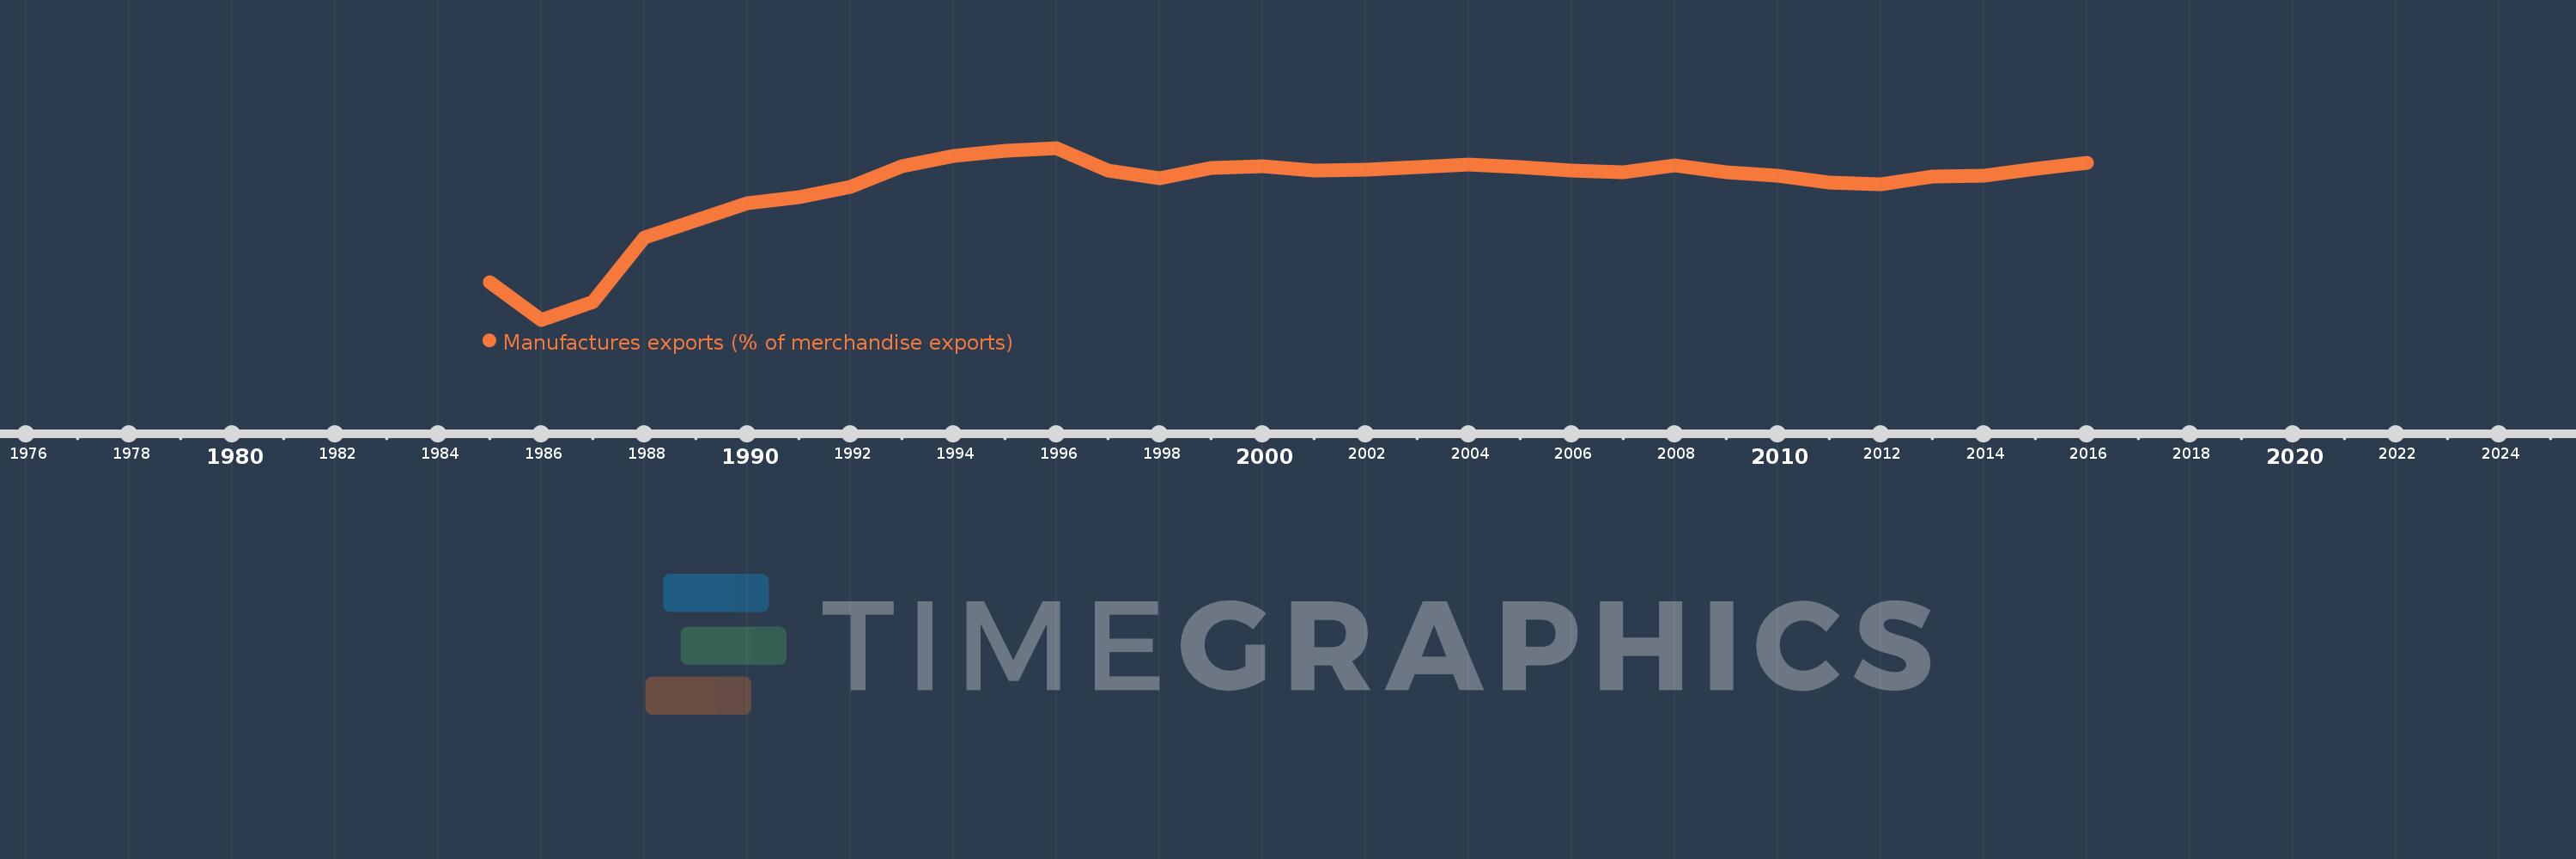
Manufactures exports (% of merchandise exports)
2016,2015,2014,2013,2012,2011,2010,2009,2008,2007,2006,2005,2004,2003,2002,2001,2000,1999,1998,1997,1996,1995,1994,1993,1992,1991,1990,1989,1988,1987,1986,1985
This statistics in other country:
AfghanistanAlbaniaAlgeriaAndorraAngolaAntigua and BarbudaArab WorldArgentinaArmeniaArubaAustraliaAustriaAzerbaijanBahamas, TheBahrainBangladeshBarbadosBelarusBelgiumBelizeBeninBermudaBhutanBoliviaBosnia and HerzegovinaBotswanaBrazilBrunei DarussalamBulgariaBurkina FasoBurundiCabo VerdeCambodiaCameroonCanadaCaribbean small statesCayman IslandsCentral African RepublicCentral Europe and the BalticsChadChileChinaColombiaComorosCongo, Dem. Rep.Congo, Rep.Costa RicaCote d'IvoireCroatiaCubaCyprusCzech RepublicDenmarkDjiboutiDominicaDominican RepublicEarly-demographic dividendEast Asia & PacificEast Asia & Pacific (excluding high income)East Asia & Pacific (IDA & IBRD countries)EcuadorEgypt, Arab Rep.El SalvadorEquatorial GuineaEritreaEstoniaEthiopiaEuro areaEurope & Central AsiaEurope & Central Asia (excluding high income)Europe & Central Asia (IDA & IBRD countries)European UnionFaroe IslandsFijiFinlandFragile and conflict affected situationsFranceFrench PolynesiaGabonGambia, TheGeorgiaGermanyGhanaGreeceGreenlandGrenadaGuatemalaGuineaGuinea-BissauGuyanaHaitiHeavily indebted poor countries (HIPC)High incomeHondurasHong Kong SAR, ChinaHungaryIBRD onlyIcelandIDA & IBRD totalIDA blendIDA onlyIDA totalIndiaIndonesiaIran, Islamic Rep.IraqIrelandIsraelItalyJamaicaJapanJordanKazakhstanKenyaKiribatiKorea, Rep.KuwaitKyrgyz RepublicLao PDRLate-demographic dividendLatin America & Caribbean Latin America & Caribbean (excluding high income)Latin America & the Caribbean (IDA & IBRD countries)LatviaLeast developed countries: UN classificationLebanonLesothoLiberiaLibyaLithuaniaLow & middle incomeLower middle incomeLuxembourgMacao SAR, ChinaMacedonia, FYRMadagascarMalawiMalaysiaMaldivesMaliMaltaMauritaniaMauritiusMexicoMiddle East & North AfricaMiddle East & North Africa (excluding high income)Middle East & North Africa (IDA & IBRD countries)Middle incomeMoldovaMongoliaMoroccoMozambiqueMyanmarNamibiaNepalNetherlandsNew CaledoniaNew ZealandNicaraguaNigerNigeriaNorth AmericaNorwayOECD membersOmanOther small statesPacific island small statesPakistanPalauPanamaPapua New GuineaParaguayPeruPhilippinesPolandPortugalPost-demographic dividendPre-demographic dividendQatarRomaniaRussian FederationRwandaSamoaSao Tome and PrincipeSaudi ArabiaSenegalSerbiaSeychellesSierra LeoneSingaporeSlovak RepublicSloveniaSmall statesSolomon IslandsSomaliaSouth AfricaSouth AsiaSouth Asia (IDA & IBRD)SpainSri LankaSt. Kitts and NevisSt. LuciaSt. Vincent and the GrenadinesSub-Saharan Africa Sub-Saharan Africa (excluding high income)Sub-Saharan Africa (IDA & IBRD countries)SudanSurinameSwazilandSwedenSwitzerlandSyrian Arab RepublicTajikistanTanzaniaThailandTimor-LesteTogoTongaTrinidad and TobagoTunisiaTurkeyTurkmenistanTurks and Caicos IslandsTuvaluUgandaUkraineUnited Arab EmiratesUnited KingdomUnited StatesUpper middle incomeUruguayVanuatuVenezuela, RBVietnamVirgin Islands (U.S.)WorldYemen, Rep.ZambiaZimbabwe Timeline:
This timeline shows a graph from 1985 to 2016 of Upper middle income. No data until 1984. Number of actual observations by date: 32.
Source name:
World Development Indicators
Source organization:
World Bank staff estimates from the Comtrade database maintained by the United Nations Statistics Division.
Categories, topics:
Private Sector, Trade
Last updated:
apr 23, 2017
Indicators value changes by year
Maximum:
71.109
jan 1, 1996
At the date of observation
Value
Absolute change
Change from previous value
jan 1, 1985
37.452
+37.452
0.0%
jan 1, 1986
27.96
-9.493
-25.35%
jan 1, 1987
32.417
+4.457
15.94%
jan 1, 1988
48.67
+16.254
50.14%
jan 1, 1989
52.845
+4.174
8.58%
jan 1, 1990
57.182
+4.337
8.21%
jan 1, 1991
58.642
+1.46
2.55%
jan 1, 1992
61.389
+2.747
4.68%
jan 1, 1993
66.541
+5.152
8.39%
jan 1, 1994
69.071
+2.53
3.8%
jan 1, 1995
70.291
+1.22
1.77%
jan 1, 1996
71.109
+0.818
1.16%
jan 1, 1997
65.5
-5.609
-7.89%
jan 1, 1998
63.541
-1.959
-2.99%
jan 1, 1999
66.022
+2.482
3.91%
jan 1, 2000
66.547
+0.524
0.79%
jan 1, 2001
65.416
-1.131
-1.7%
jan 1, 2002
65.678
+0.262
0.4%
jan 1, 2003
66.286
+0.608
0.93%
jan 1, 2004
66.859
+0.573
0.86%
jan 1, 2005
66.22
-0.639
-0.96%
jan 1, 2006
65.482
-0.738
-1.11%
jan 1, 2007
64.92
-0.562
-0.86%
jan 1, 2008
66.638
+1.717
2.65%
jan 1, 2009
65.03
-1.608
-2.41%
jan 1, 2010
64.118
-0.912
-1.4%
jan 1, 2011
62.379
-1.739
-2.71%
jan 1, 2012
61.975
-0.404
-0.65%
jan 1, 2013
63.997
+2.022
3.26%
jan 1, 2014
64.205
+0.208
0.33%
jan 1, 2015
65.848
+1.643
2.56%
jan 1, 2016
67.429
+1.581
2.4%
Ranking of countries by current statistics by years


Comments: