29
/
en
AIzaSyAYiBZKx7MnpbEhh9jyipgxe19OcubqV5w
April 1, 2024
81977
Belgium
BEL
true
2
1
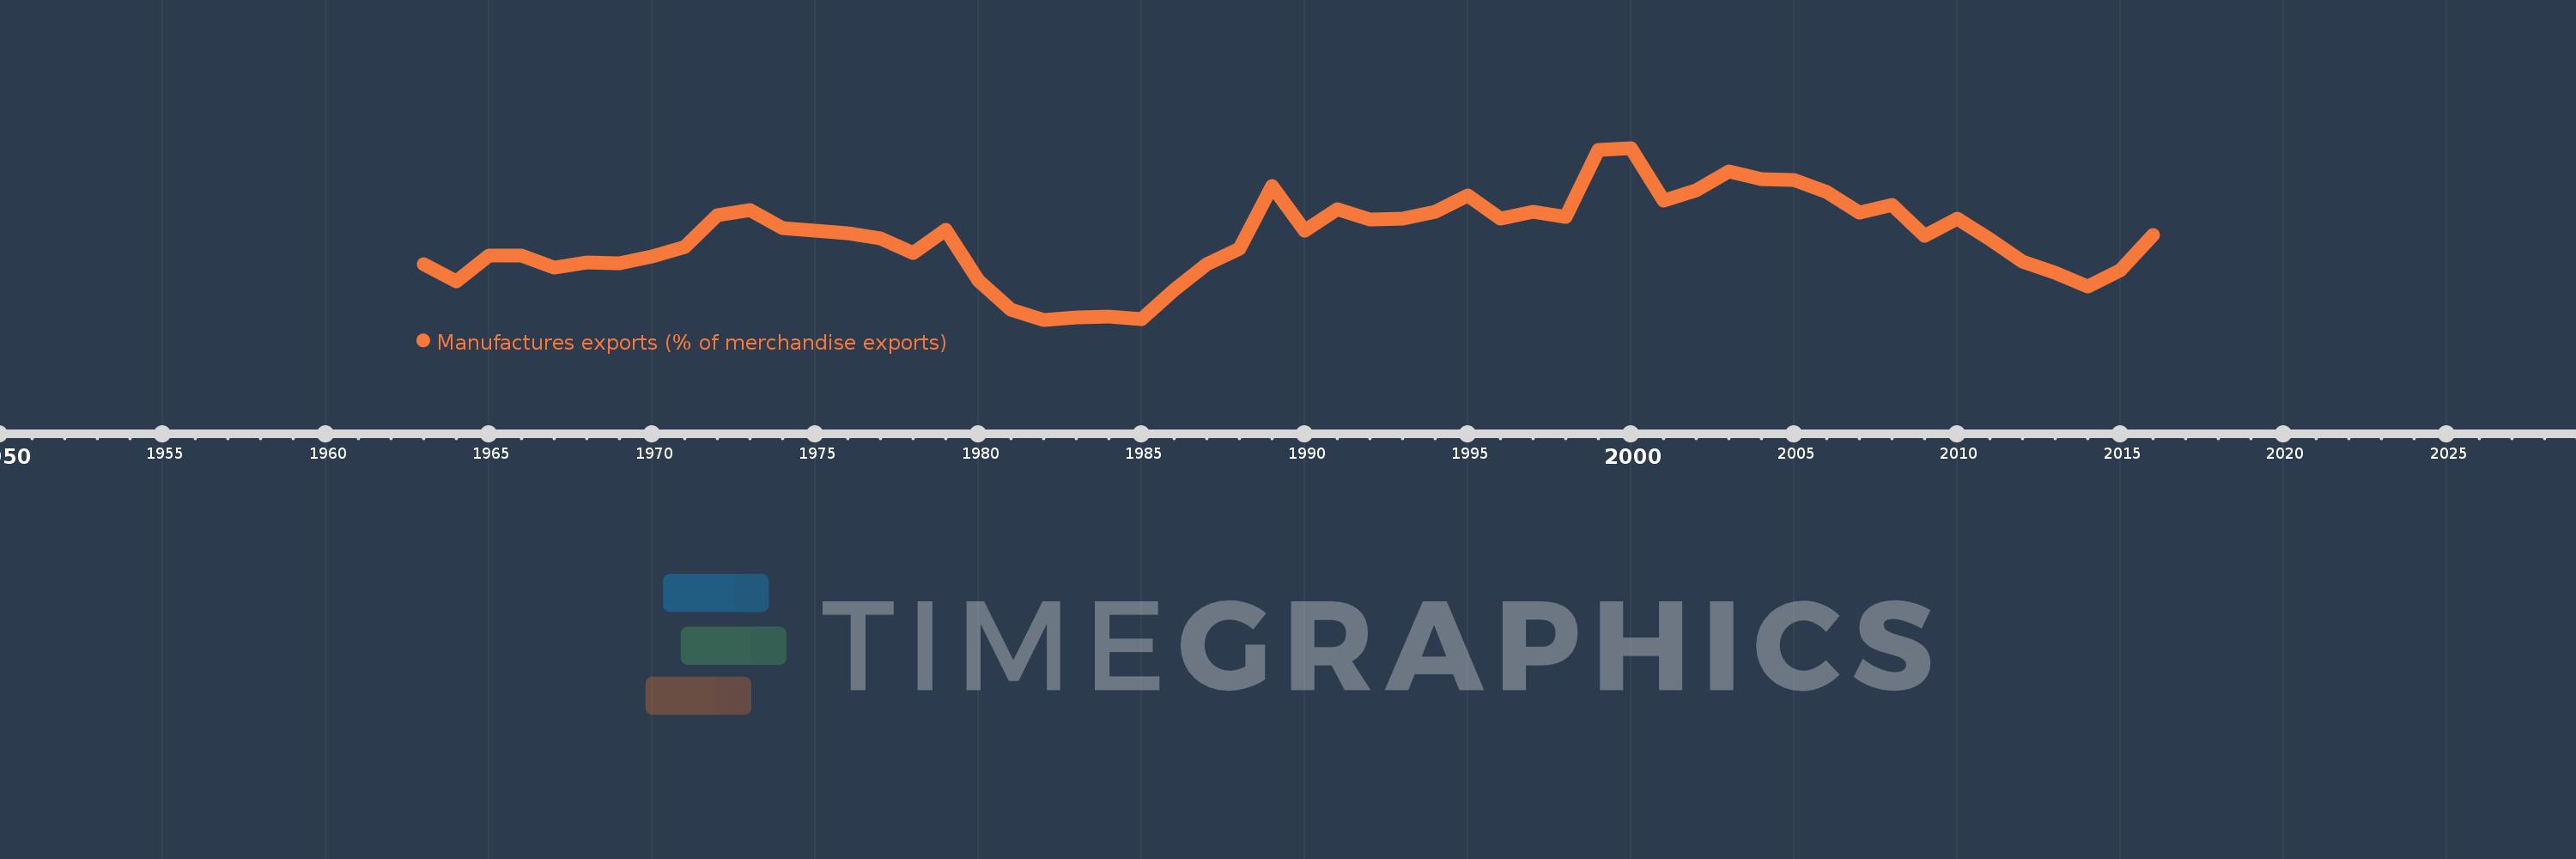
Manufactures exports (% of merchandise exports)
2016,2015,2014,2013,2012,2011,2010,2009,2008,2007,2006,2005,2004,2003,2002,2001,2000,1999,1998,1997,1996,1995,1994,1993,1992,1991,1990,1989,1988,1987,1986,1985,1984,1983,1982,1981,1980,1979,1978,1977,1976,1975,1974,1973,1972,1971,1970,1969,1968,1967,1966,1965,1964,1963
This statistics in other country:
AfghanistanAlbaniaAlgeriaAndorraAngolaAntigua and BarbudaArab WorldArgentinaArmeniaArubaAustraliaAustriaAzerbaijanBahamas, TheBahrainBangladeshBarbadosBelarusBelgiumBelizeBeninBermudaBhutanBoliviaBosnia and HerzegovinaBotswanaBrazilBrunei DarussalamBulgariaBurkina FasoBurundiCabo VerdeCambodiaCameroonCanadaCaribbean small statesCayman IslandsCentral African RepublicCentral Europe and the BalticsChadChileChinaColombiaComorosCongo, Dem. Rep.Congo, Rep.Costa RicaCote d'IvoireCroatiaCubaCyprusCzech RepublicDenmarkDjiboutiDominicaDominican RepublicEarly-demographic dividendEast Asia & PacificEast Asia & Pacific (excluding high income)East Asia & Pacific (IDA & IBRD countries)EcuadorEgypt, Arab Rep.El SalvadorEquatorial GuineaEritreaEstoniaEthiopiaEuro areaEurope & Central AsiaEurope & Central Asia (excluding high income)Europe & Central Asia (IDA & IBRD countries)European UnionFaroe IslandsFijiFinlandFragile and conflict affected situationsFranceFrench PolynesiaGabonGambia, TheGeorgiaGermanyGhanaGreeceGreenlandGrenadaGuatemalaGuineaGuinea-BissauGuyanaHaitiHeavily indebted poor countries (HIPC)High incomeHondurasHong Kong SAR, ChinaHungaryIBRD onlyIcelandIDA & IBRD totalIDA blendIDA onlyIDA totalIndiaIndonesiaIran, Islamic Rep.IraqIrelandIsraelItalyJamaicaJapanJordanKazakhstanKenyaKiribatiKorea, Rep.KuwaitKyrgyz RepublicLao PDRLate-demographic dividendLatin America & Caribbean Latin America & Caribbean (excluding high income)Latin America & the Caribbean (IDA & IBRD countries)LatviaLeast developed countries: UN classificationLebanonLesothoLiberiaLibyaLithuaniaLow & middle incomeLower middle incomeLuxembourgMacao SAR, ChinaMacedonia, FYRMadagascarMalawiMalaysiaMaldivesMaliMaltaMauritaniaMauritiusMexicoMiddle East & North AfricaMiddle East & North Africa (excluding high income)Middle East & North Africa (IDA & IBRD countries)Middle incomeMoldovaMongoliaMoroccoMozambiqueMyanmarNamibiaNepalNetherlandsNew CaledoniaNew ZealandNicaraguaNigerNigeriaNorth AmericaNorwayOECD membersOmanOther small statesPacific island small statesPakistanPalauPanamaPapua New GuineaParaguayPeruPhilippinesPolandPortugalPost-demographic dividendPre-demographic dividendQatarRomaniaRussian FederationRwandaSamoaSao Tome and PrincipeSaudi ArabiaSenegalSerbiaSeychellesSierra LeoneSingaporeSlovak RepublicSloveniaSmall statesSolomon IslandsSomaliaSouth AfricaSouth AsiaSouth Asia (IDA & IBRD)SpainSri LankaSt. Kitts and NevisSt. LuciaSt. Vincent and the GrenadinesSub-Saharan Africa Sub-Saharan Africa (excluding high income)Sub-Saharan Africa (IDA & IBRD countries)SudanSurinameSwazilandSwedenSwitzerlandSyrian Arab RepublicTajikistanTanzaniaThailandTimor-LesteTogoTongaTrinidad and TobagoTunisiaTurkeyTurkmenistanTurks and Caicos IslandsTuvaluUgandaUkraineUnited Arab EmiratesUnited KingdomUnited StatesUpper middle incomeUruguayVanuatuVenezuela, RBVietnamVirgin Islands (U.S.)WorldYemen, Rep.ZambiaZimbabwe Timeline:
This timeline shows a graph from 1963 to 2016 of Belgium. No data until 1962. Number of actual observations by date: 54.
Source name:
World Development Indicators
Source organization:
World Bank staff estimates from the Comtrade database maintained by the United Nations Statistics Division.
Categories, topics:
Private Sector, Trade
Last updated:
apr 23, 2017
Indicators value changes by year
Minimum:
68.517
jan 1, 1982
Maximum:
82.239
jan 1, 2000
At the date of observation
Value
Absolute change
Change from previous value
jan 1, 1963
72.98
+72.98
0.0%
jan 1, 1964
71.564
-1.417
-1.94%
jan 1, 1965
73.633
+2.069
2.89%
jan 1, 1966
73.617
-0.016
-0.02%
jan 1, 1967
72.702
-0.915
-1.24%
jan 1, 1968
73.091
+0.389
0.54%
jan 1, 1969
73.01
-0.082
-0.11%
jan 1, 1970
73.6
+0.59
0.81%
jan 1, 1971
74.294
+0.694
0.94%
jan 1, 1972
76.847
+2.553
3.44%
jan 1, 1973
77.31
+0.463
0.6%
jan 1, 1974
75.869
-1.441
-1.86%
jan 1, 1975
75.665
-0.204
-0.27%
jan 1, 1976
75.445
-0.22
-0.29%
jan 1, 1977
75.017
-0.427
-0.57%
jan 1, 1978
73.841
-1.176
-1.57%
jan 1, 1979
75.672
+1.831
2.48%
jan 1, 1980
71.67
-4.002
-5.29%
jan 1, 1981
69.353
-2.317
-3.23%
jan 1, 1982
68.517
-0.835
-1.2%
jan 1, 1983
68.688
+0.17
0.25%
jan 1, 1984
68.766
+0.079
0.11%
jan 1, 1985
68.591
-0.175
-0.25%
jan 1, 1986
70.868
+2.277
3.32%
jan 1, 1987
72.953
+2.084
2.94%
jan 1, 1988
74.216
+1.263
1.73%
jan 1, 1989
79.204
+4.989
6.72%
jan 1, 1990
75.623
-3.581
-4.52%
jan 1, 1991
77.345
+1.722
2.28%
jan 1, 1992
76.552
-0.794
-1.03%
jan 1, 1993
76.589
+0.038
0.05%
jan 1, 1994
77.139
+0.55
0.72%
jan 1, 1995
78.46
+1.321
1.71%
jan 1, 1996
76.614
-1.846
-2.35%
jan 1, 1997
77.11
+0.495
0.65%
jan 1, 1998
76.725
-0.385
-0.5%
jan 1, 1999
82.102
+5.377
7.01%
jan 1, 2000
82.239
+0.137
0.17%
jan 1, 2001
78.066
-4.173
-5.07%
jan 1, 2002
78.884
+0.819
1.05%
jan 1, 2003
80.378
+1.493
1.89%
jan 1, 2004
79.735
-0.642
-0.8%
jan 1, 2005
79.653
-0.082
-0.1%
jan 1, 2006
78.698
-0.955
-1.2%
jan 1, 2007
77.089
-1.61
-2.05%
jan 1, 2008
77.718
+0.629
0.82%
jan 1, 2009
75.246
-2.472
-3.18%
jan 1, 2010
76.593
+1.347
1.79%
jan 1, 2011
74.966
-1.627
-2.12%
jan 1, 2012
73.149
-1.817
-2.42%
jan 1, 2013
72.288
-0.86
-1.18%
jan 1, 2014
71.142
-1.147
-1.59%
jan 1, 2015
72.51
+1.368
1.92%
jan 1, 2016
75.294
+2.785
3.84%
Ranking of countries by current statistics by years


Comments: