29
/
en
AIzaSyAYiBZKx7MnpbEhh9jyipgxe19OcubqV5w
April 1, 2024
53559
Other small states
OSS
false
2
1
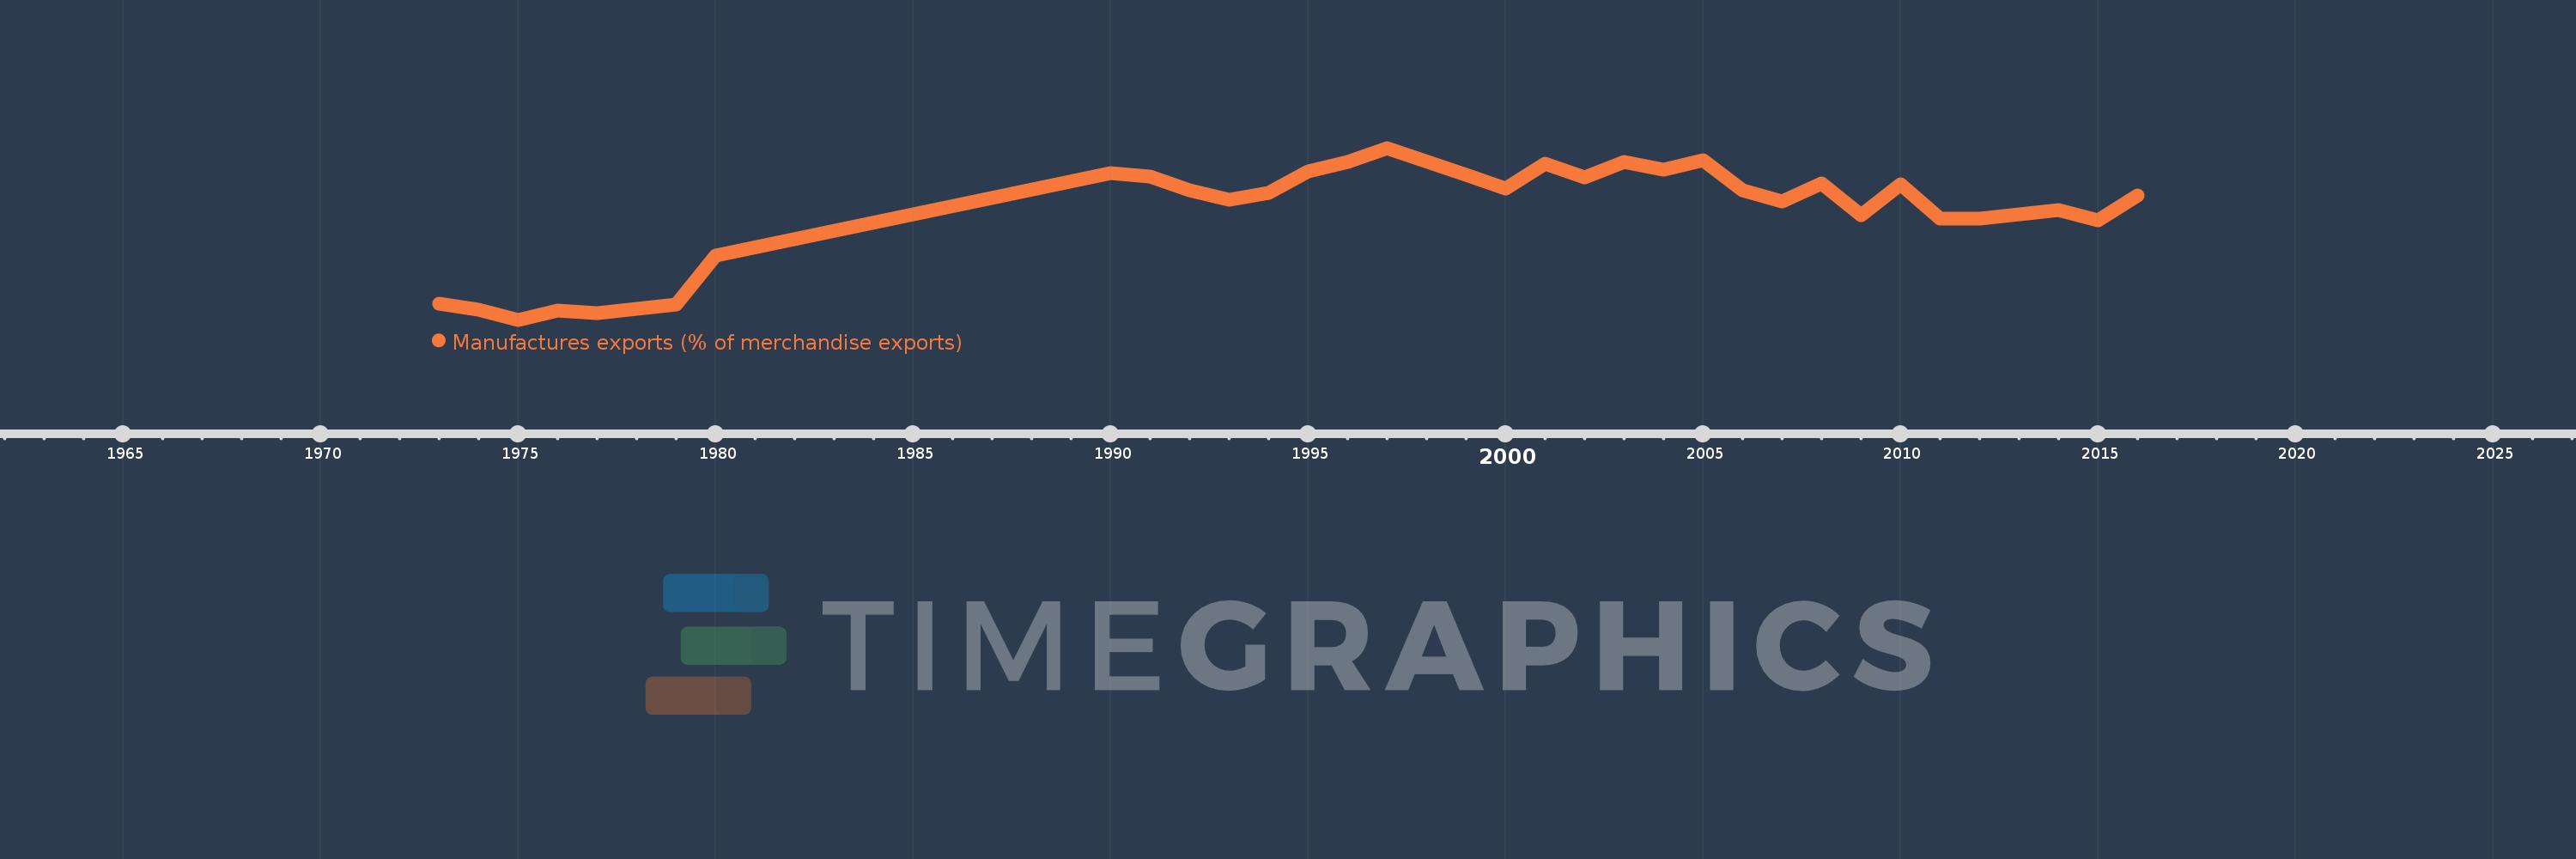
Manufactures exports (% of merchandise exports)
2016,2015,2014,2012,2011,2010,2009,2008,2007,2006,2005,2004,2003,2002,2001,2000,1999,1997,1996,1995,1994,1993,1992,1991,1990,1980,1979,1977,1976,1975,1974,1973
This statistics in other country:
AfghanistanAlbaniaAlgeriaAndorraAngolaAntigua and BarbudaArab WorldArgentinaArmeniaArubaAustraliaAustriaAzerbaijanBahamas, TheBahrainBangladeshBarbadosBelarusBelgiumBelizeBeninBermudaBhutanBoliviaBosnia and HerzegovinaBotswanaBrazilBrunei DarussalamBulgariaBurkina FasoBurundiCabo VerdeCambodiaCameroonCanadaCaribbean small statesCayman IslandsCentral African RepublicCentral Europe and the BalticsChadChileChinaColombiaComorosCongo, Dem. Rep.Congo, Rep.Costa RicaCote d'IvoireCroatiaCubaCyprusCzech RepublicDenmarkDjiboutiDominicaDominican RepublicEarly-demographic dividendEast Asia & PacificEast Asia & Pacific (excluding high income)East Asia & Pacific (IDA & IBRD countries)EcuadorEgypt, Arab Rep.El SalvadorEquatorial GuineaEritreaEstoniaEthiopiaEuro areaEurope & Central AsiaEurope & Central Asia (excluding high income)Europe & Central Asia (IDA & IBRD countries)European UnionFaroe IslandsFijiFinlandFragile and conflict affected situationsFranceFrench PolynesiaGabonGambia, TheGeorgiaGermanyGhanaGreeceGreenlandGrenadaGuatemalaGuineaGuinea-BissauGuyanaHaitiHeavily indebted poor countries (HIPC)High incomeHondurasHong Kong SAR, ChinaHungaryIBRD onlyIcelandIDA & IBRD totalIDA blendIDA onlyIDA totalIndiaIndonesiaIran, Islamic Rep.IraqIrelandIsraelItalyJamaicaJapanJordanKazakhstanKenyaKiribatiKorea, Rep.KuwaitKyrgyz RepublicLao PDRLate-demographic dividendLatin America & Caribbean Latin America & Caribbean (excluding high income)Latin America & the Caribbean (IDA & IBRD countries)LatviaLeast developed countries: UN classificationLebanonLesothoLiberiaLibyaLithuaniaLow & middle incomeLower middle incomeLuxembourgMacao SAR, ChinaMacedonia, FYRMadagascarMalawiMalaysiaMaldivesMaliMaltaMauritaniaMauritiusMexicoMiddle East & North AfricaMiddle East & North Africa (excluding high income)Middle East & North Africa (IDA & IBRD countries)Middle incomeMoldovaMongoliaMoroccoMozambiqueMyanmarNamibiaNepalNetherlandsNew CaledoniaNew ZealandNicaraguaNigerNigeriaNorth AmericaNorwayOECD membersOmanOther small statesPacific island small statesPakistanPalauPanamaPapua New GuineaParaguayPeruPhilippinesPolandPortugalPost-demographic dividendPre-demographic dividendQatarRomaniaRussian FederationRwandaSamoaSao Tome and PrincipeSaudi ArabiaSenegalSerbiaSeychellesSierra LeoneSingaporeSlovak RepublicSloveniaSmall statesSolomon IslandsSomaliaSouth AfricaSouth AsiaSouth Asia (IDA & IBRD)SpainSri LankaSt. Kitts and NevisSt. LuciaSt. Vincent and the GrenadinesSub-Saharan Africa Sub-Saharan Africa (excluding high income)Sub-Saharan Africa (IDA & IBRD countries)SudanSurinameSwazilandSwedenSwitzerlandSyrian Arab RepublicTajikistanTanzaniaThailandTimor-LesteTogoTongaTrinidad and TobagoTunisiaTurkeyTurkmenistanTurks and Caicos IslandsTuvaluUgandaUkraineUnited Arab EmiratesUnited KingdomUnited StatesUpper middle incomeUruguayVanuatuVenezuela, RBVietnamVirgin Islands (U.S.)WorldYemen, Rep.ZambiaZimbabwe Timeline:
This timeline shows a graph from 1973 to 2016 of Other small states. No data until 1972. Number of actual observations by date: 32.
Source name:
World Development Indicators
Source organization:
World Bank staff estimates from the Comtrade database maintained by the United Nations Statistics Division.
Categories, topics:
Private Sector, Trade
Last updated:
apr 23, 2017
Indicators value changes by year
Maximum:
25.392
jan 1, 1997
At the date of observation
Value
Absolute change
Change from previous value
jan 1, 1973
7.253
+7.253
0.0%
jan 1, 1974
6.539
-0.713
-9.83%
jan 1, 1975
5.365
-1.174
-17.96%
jan 1, 1976
6.435
+1.07
19.95%
jan 1, 1977
6.145
-0.29
-4.51%
jan 1, 1979
7.171
+1.026
16.7%
jan 1, 1980
12.875
+5.704
79.53%
jan 1, 1990
22.418
+9.543
74.12%
jan 1, 1991
22.024
-0.394
-1.76%
jan 1, 1992
20.476
-1.548
-7.03%
jan 1, 1993
19.349
-1.127
-5.51%
jan 1, 1994
20.156
+0.808
4.17%
jan 1, 1995
22.698
+2.542
12.61%
jan 1, 1996
23.774
+1.076
4.74%
jan 1, 1997
25.392
+1.618
6.81%
jan 1, 1999
22.216
-3.176
-12.51%
jan 1, 2000
20.662
-1.554
-7.0%
jan 1, 2001
23.54
+2.879
13.93%
jan 1, 2002
21.981
-1.56
-6.63%
jan 1, 2003
23.796
+1.815
8.26%
jan 1, 2004
22.811
-0.985
-4.14%
jan 1, 2005
23.931
+1.12
4.91%
jan 1, 2006
20.464
-3.467
-14.49%
jan 1, 2007
19.172
-1.293
-6.32%
jan 1, 2008
21.245
+2.073
10.81%
jan 1, 2009
17.587
-3.657
-17.22%
jan 1, 2010
21.204
+3.617
20.56%
jan 1, 2011
17.122
-4.082
-19.25%
jan 1, 2012
17.148
+0.026
0.15%
jan 1, 2014
18.198
+1.049
6.12%
jan 1, 2015
16.919
-1.279
-7.03%
jan 1, 2016
19.871
+2.952
17.45%
Ranking of countries by current statistics by years


Comments: