29
/
en
AIzaSyAYiBZKx7MnpbEhh9jyipgxe19OcubqV5w
April 1, 2024
52791
OECD members
OED
false
2
1
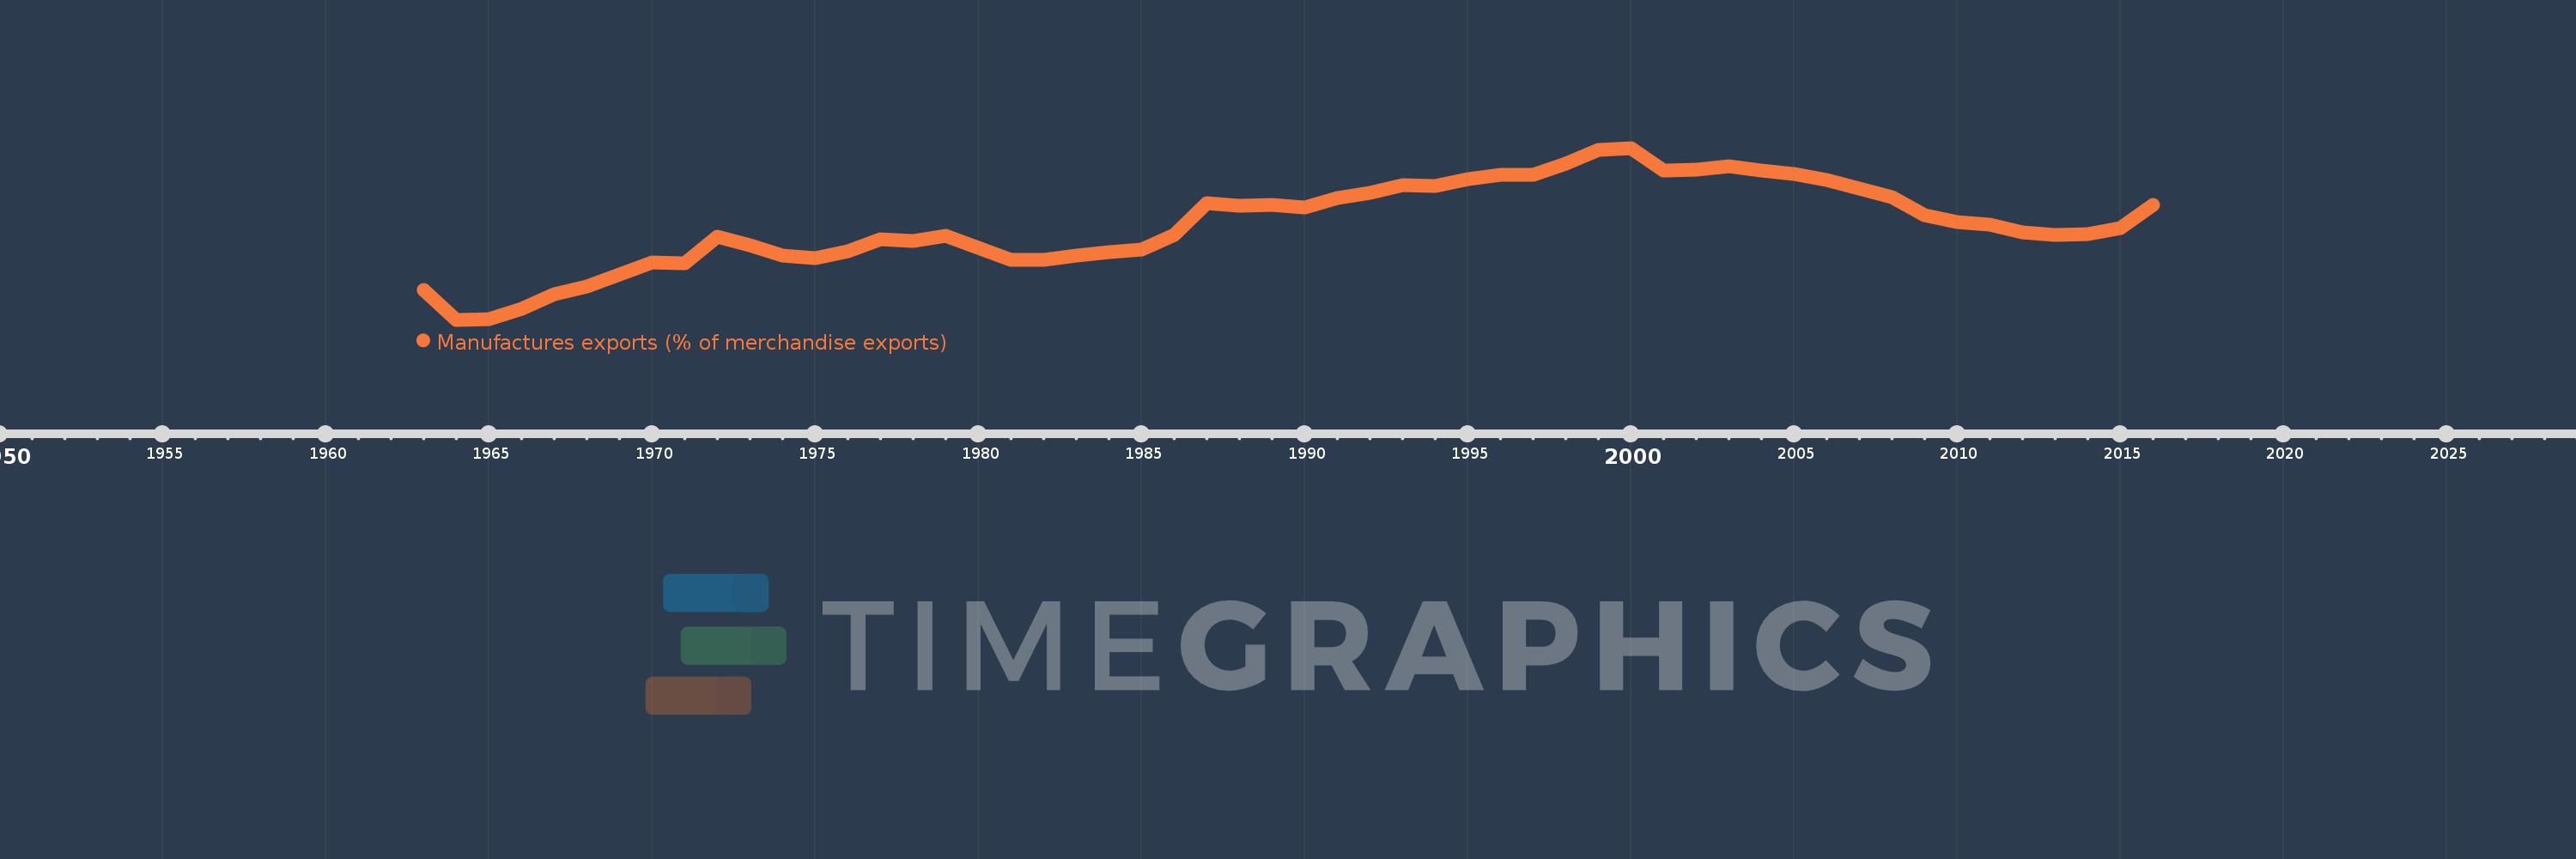
Manufactures exports (% of merchandise exports)
2016,2015,2014,2013,2012,2011,2010,2009,2008,2007,2006,2005,2004,2003,2002,2001,2000,1999,1998,1997,1996,1995,1994,1993,1992,1991,1990,1989,1988,1987,1986,1985,1984,1983,1982,1981,1980,1979,1978,1977,1976,1975,1974,1973,1972,1971,1970,1969,1968,1967,1966,1965,1964,1963
This statistics in other country:
AfghanistanAlbaniaAlgeriaAndorraAngolaAntigua and BarbudaArab WorldArgentinaArmeniaArubaAustraliaAustriaAzerbaijanBahamas, TheBahrainBangladeshBarbadosBelarusBelgiumBelizeBeninBermudaBhutanBoliviaBosnia and HerzegovinaBotswanaBrazilBrunei DarussalamBulgariaBurkina FasoBurundiCabo VerdeCambodiaCameroonCanadaCaribbean small statesCayman IslandsCentral African RepublicCentral Europe and the BalticsChadChileChinaColombiaComorosCongo, Dem. Rep.Congo, Rep.Costa RicaCote d'IvoireCroatiaCubaCyprusCzech RepublicDenmarkDjiboutiDominicaDominican RepublicEarly-demographic dividendEast Asia & PacificEast Asia & Pacific (excluding high income)East Asia & Pacific (IDA & IBRD countries)EcuadorEgypt, Arab Rep.El SalvadorEquatorial GuineaEritreaEstoniaEthiopiaEuro areaEurope & Central AsiaEurope & Central Asia (excluding high income)Europe & Central Asia (IDA & IBRD countries)European UnionFaroe IslandsFijiFinlandFragile and conflict affected situationsFranceFrench PolynesiaGabonGambia, TheGeorgiaGermanyGhanaGreeceGreenlandGrenadaGuatemalaGuineaGuinea-BissauGuyanaHaitiHeavily indebted poor countries (HIPC)High incomeHondurasHong Kong SAR, ChinaHungaryIBRD onlyIcelandIDA & IBRD totalIDA blendIDA onlyIDA totalIndiaIndonesiaIran, Islamic Rep.IraqIrelandIsraelItalyJamaicaJapanJordanKazakhstanKenyaKiribatiKorea, Rep.KuwaitKyrgyz RepublicLao PDRLate-demographic dividendLatin America & Caribbean Latin America & Caribbean (excluding high income)Latin America & the Caribbean (IDA & IBRD countries)LatviaLeast developed countries: UN classificationLebanonLesothoLiberiaLibyaLithuaniaLow & middle incomeLower middle incomeLuxembourgMacao SAR, ChinaMacedonia, FYRMadagascarMalawiMalaysiaMaldivesMaliMaltaMauritaniaMauritiusMexicoMiddle East & North AfricaMiddle East & North Africa (excluding high income)Middle East & North Africa (IDA & IBRD countries)Middle incomeMoldovaMongoliaMoroccoMozambiqueMyanmarNamibiaNepalNetherlandsNew CaledoniaNew ZealandNicaraguaNigerNigeriaNorth AmericaNorwayOECD membersOmanOther small statesPacific island small statesPakistanPalauPanamaPapua New GuineaParaguayPeruPhilippinesPolandPortugalPost-demographic dividendPre-demographic dividendQatarRomaniaRussian FederationRwandaSamoaSao Tome and PrincipeSaudi ArabiaSenegalSerbiaSeychellesSierra LeoneSingaporeSlovak RepublicSloveniaSmall statesSolomon IslandsSomaliaSouth AfricaSouth AsiaSouth Asia (IDA & IBRD)SpainSri LankaSt. Kitts and NevisSt. LuciaSt. Vincent and the GrenadinesSub-Saharan Africa Sub-Saharan Africa (excluding high income)Sub-Saharan Africa (IDA & IBRD countries)SudanSurinameSwazilandSwedenSwitzerlandSyrian Arab RepublicTajikistanTanzaniaThailandTimor-LesteTogoTongaTrinidad and TobagoTunisiaTurkeyTurkmenistanTurks and Caicos IslandsTuvaluUgandaUkraineUnited Arab EmiratesUnited KingdomUnited StatesUpper middle incomeUruguayVanuatuVenezuela, RBVietnamVirgin Islands (U.S.)WorldYemen, Rep.ZambiaZimbabwe Timeline:
This timeline shows a graph from 1963 to 2016 of OECD members. No data until 1962. Number of actual observations by date: 54.
Source name:
World Development Indicators
Source organization:
World Bank staff estimates from the Comtrade database maintained by the United Nations Statistics Division.
Categories, topics:
Private Sector, Trade
Last updated:
apr 23, 2017
Indicators value changes by year
Minimum:
62.233
jan 1, 1964
Maximum:
80.912
jan 1, 2000
At the date of observation
Value
Absolute change
Change from previous value
jan 1, 1963
65.468
+65.468
0.0%
jan 1, 1964
62.233
-3.235
-4.94%
jan 1, 1965
62.293
+0.059
0.1%
jan 1, 1966
63.385
+1.092
1.75%
jan 1, 1967
64.991
+1.606
2.53%
jan 1, 1968
65.818
+0.826
1.27%
jan 1, 1969
67.153
+1.335
2.03%
jan 1, 1970
68.509
+1.356
2.02%
jan 1, 1971
68.373
-0.136
-0.2%
jan 1, 1972
71.301
+2.928
4.28%
jan 1, 1973
70.353
-0.948
-1.33%
jan 1, 1974
69.233
-1.119
-1.59%
jan 1, 1975
68.912
-0.321
-0.46%
jan 1, 1976
69.669
+0.757
1.1%
jan 1, 1977
70.95
+1.281
1.84%
jan 1, 1978
70.796
-0.155
-0.22%
jan 1, 1979
71.367
+0.571
0.81%
jan 1, 1980
70.074
-1.293
-1.81%
jan 1, 1981
68.7
-1.374
-1.96%
jan 1, 1982
68.722
+0.023
0.03%
jan 1, 1983
69.182
+0.459
0.67%
jan 1, 1984
69.625
+0.443
0.64%
jan 1, 1985
69.88
+0.255
0.37%
jan 1, 1986
71.429
+1.548
2.22%
jan 1, 1987
74.868
+3.44
4.82%
jan 1, 1988
74.619
-0.25
-0.33%
jan 1, 1989
74.747
+0.128
0.17%
jan 1, 1990
74.439
-0.308
-0.41%
jan 1, 1991
75.471
+1.032
1.39%
jan 1, 1992
76.0
+0.529
0.7%
jan 1, 1993
76.907
+0.907
1.19%
jan 1, 1994
76.788
-0.119
-0.15%
jan 1, 1995
77.53
+0.742
0.97%
jan 1, 1996
78.008
+0.478
0.62%
jan 1, 1997
78.024
+0.016
0.02%
jan 1, 1998
79.158
+1.134
1.45%
jan 1, 1999
80.696
+1.539
1.94%
jan 1, 2000
80.912
+0.216
0.27%
jan 1, 2001
78.48
-2.432
-3.01%
jan 1, 2002
78.56
+0.079
0.1%
jan 1, 2003
78.927
+0.367
0.47%
jan 1, 2004
78.455
-0.472
-0.6%
jan 1, 2005
78.048
-0.407
-0.52%
jan 1, 2006
77.415
-0.633
-0.81%
jan 1, 2007
76.508
-0.907
-1.17%
jan 1, 2008
75.596
-0.912
-1.19%
jan 1, 2009
73.553
-2.043
-2.7%
jan 1, 2010
72.828
-0.725
-0.99%
jan 1, 2011
72.537
-0.291
-0.4%
jan 1, 2012
71.75
-0.788
-1.09%
jan 1, 2013
71.446
-0.303
-0.42%
jan 1, 2014
71.517
+0.071
0.1%
jan 1, 2015
72.243
+0.727
1.02%
jan 1, 2016
74.725
+2.482
3.44%
Ranking of countries by current statistics by years


Comments: