29
/
en
AIzaSyAYiBZKx7MnpbEhh9jyipgxe19OcubqV5w
April 1, 2024
180124
Libya
LBY
true
2
1
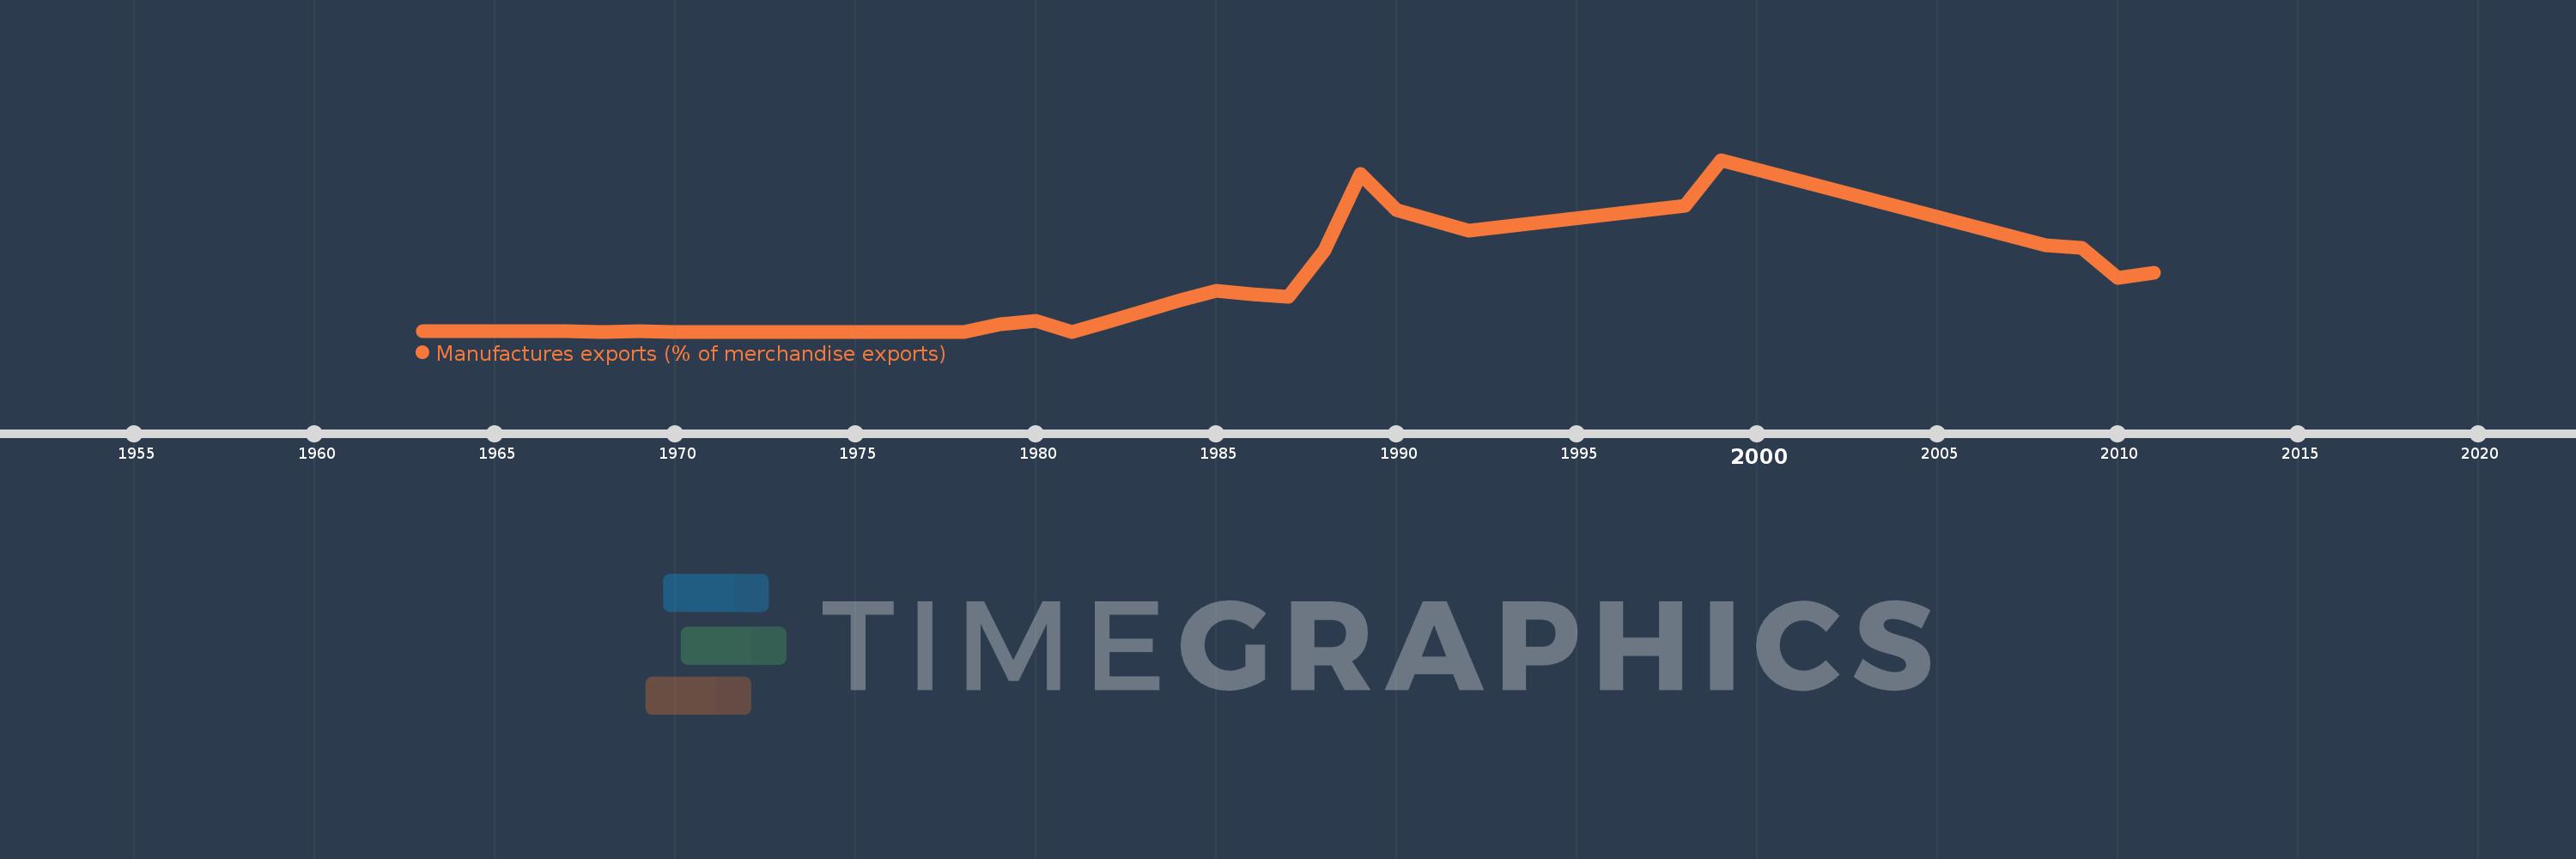
Manufactures exports (% of merchandise exports)
2011,2010,2009,2008,1999,1998,1992,1990,1989,1988,1987,1986,1985,1984,1982,1981,1980,1979,1978,1977,1976,1975,1974,1973,1972,1971,1970,1969,1968,1967,1966,1965,1964,1963
This statistics in other country:
AfghanistanAlbaniaAlgeriaAndorraAngolaAntigua and BarbudaArab WorldArgentinaArmeniaArubaAustraliaAustriaAzerbaijanBahamas, TheBahrainBangladeshBarbadosBelarusBelgiumBelizeBeninBermudaBhutanBoliviaBosnia and HerzegovinaBotswanaBrazilBrunei DarussalamBulgariaBurkina FasoBurundiCabo VerdeCambodiaCameroonCanadaCaribbean small statesCayman IslandsCentral African RepublicCentral Europe and the BalticsChadChileChinaColombiaComorosCongo, Dem. Rep.Congo, Rep.Costa RicaCote d'IvoireCroatiaCubaCyprusCzech RepublicDenmarkDjiboutiDominicaDominican RepublicEarly-demographic dividendEast Asia & PacificEast Asia & Pacific (excluding high income)East Asia & Pacific (IDA & IBRD countries)EcuadorEgypt, Arab Rep.El SalvadorEquatorial GuineaEritreaEstoniaEthiopiaEuro areaEurope & Central AsiaEurope & Central Asia (excluding high income)Europe & Central Asia (IDA & IBRD countries)European UnionFaroe IslandsFijiFinlandFragile and conflict affected situationsFranceFrench PolynesiaGabonGambia, TheGeorgiaGermanyGhanaGreeceGreenlandGrenadaGuatemalaGuineaGuinea-BissauGuyanaHaitiHeavily indebted poor countries (HIPC)High incomeHondurasHong Kong SAR, ChinaHungaryIBRD onlyIcelandIDA & IBRD totalIDA blendIDA onlyIDA totalIndiaIndonesiaIran, Islamic Rep.IraqIrelandIsraelItalyJamaicaJapanJordanKazakhstanKenyaKiribatiKorea, Rep.KuwaitKyrgyz RepublicLao PDRLate-demographic dividendLatin America & Caribbean Latin America & Caribbean (excluding high income)Latin America & the Caribbean (IDA & IBRD countries)LatviaLeast developed countries: UN classificationLebanonLesothoLiberiaLibyaLithuaniaLow & middle incomeLower middle incomeLuxembourgMacao SAR, ChinaMacedonia, FYRMadagascarMalawiMalaysiaMaldivesMaliMaltaMauritaniaMauritiusMexicoMiddle East & North AfricaMiddle East & North Africa (excluding high income)Middle East & North Africa (IDA & IBRD countries)Middle incomeMoldovaMongoliaMoroccoMozambiqueMyanmarNamibiaNepalNetherlandsNew CaledoniaNew ZealandNicaraguaNigerNigeriaNorth AmericaNorwayOECD membersOmanOther small statesPacific island small statesPakistanPalauPanamaPapua New GuineaParaguayPeruPhilippinesPolandPortugalPost-demographic dividendPre-demographic dividendQatarRomaniaRussian FederationRwandaSamoaSao Tome and PrincipeSaudi ArabiaSenegalSerbiaSeychellesSierra LeoneSingaporeSlovak RepublicSloveniaSmall statesSolomon IslandsSomaliaSouth AfricaSouth AsiaSouth Asia (IDA & IBRD)SpainSri LankaSt. Kitts and NevisSt. LuciaSt. Vincent and the GrenadinesSub-Saharan Africa Sub-Saharan Africa (excluding high income)Sub-Saharan Africa (IDA & IBRD countries)SudanSurinameSwazilandSwedenSwitzerlandSyrian Arab RepublicTajikistanTanzaniaThailandTimor-LesteTogoTongaTrinidad and TobagoTunisiaTurkeyTurkmenistanTurks and Caicos IslandsTuvaluUgandaUkraineUnited Arab EmiratesUnited KingdomUnited StatesUpper middle incomeUruguayVanuatuVenezuela, RBVietnamVirgin Islands (U.S.)WorldYemen, Rep.ZambiaZimbabwe Timeline:
This timeline shows a graph from 1963 to 2011 of Libya. No data until 1962. Number of actual observations by date: 34.
Source name:
World Development Indicators
Source organization:
World Bank staff estimates from the Comtrade database maintained by the United Nations Statistics Division.
Categories, topics:
Private Sector, Trade
Last updated:
apr 23, 2017
Indicators value changes by year
At the date of observation
Value
Absolute change
Change from previous value
jan 1, 1963
0.005
+0.005
0.0%
jan 1, 1964
0.002
-0.003
-57.82%
jan 1, 1965
0.002
0.0
-11.9%
jan 1, 1966
0.001
-0.001
-49.46%
jan 1, 1967
0.002
+0.001
123.9%
jan 1, 1968
0.0
-0.002
-97.07%
jan 1, 1969
0.001
+0.001
1.44K%
jan 1, 1970
0.0
-0.001
-79.45%
jan 1, 1971
0.0
+0.0
87.38%
jan 1, 1972
0.0
0.0
-98.13%
jan 1, 1973
0.0
+0.0
953.35%
jan 1, 1974
0.0
+0.0
266.52%
jan 1, 1975
0.0
0.0
-89.1%
jan 1, 1976
0.0
0.0
-96.89%
jan 1, 1977
0.0
0.0
-100.0%
jan 1, 1980
0.432
+0.152
54.31%
jan 1, 1981
0.0
-0.432
-100.0%
jan 1, 1982
0.371
+0.371
%
jan 1, 1984
1.203
+0.831
224.0%
jan 1, 1985
1.576
+0.374
31.06%
jan 1, 1986
1.465
-0.111
-7.06%
jan 1, 1987
1.356
-0.109
-7.44%
jan 1, 1988
3.154
+1.798
132.61%
jan 1, 1989
6.107
+2.953
93.62%
jan 1, 1990
4.709
-1.398
-22.89%
jan 1, 1992
3.899
-0.81
-17.2%
jan 1, 1998
4.87
+0.971
24.9%
jan 1, 1999
6.663
+1.793
36.82%
jan 1, 2008
3.364
-3.299
-49.51%
jan 1, 2009
3.238
-0.126
-3.74%
jan 1, 2010
2.097
-1.141
-35.24%
jan 1, 2011
2.278
+0.181
8.65%
Ranking of countries by current statistics by years


Comments: