29
/
en
AIzaSyAYiBZKx7MnpbEhh9jyipgxe19OcubqV5w
April 1, 2024
77337
Bahrain
BHR
true
2
1
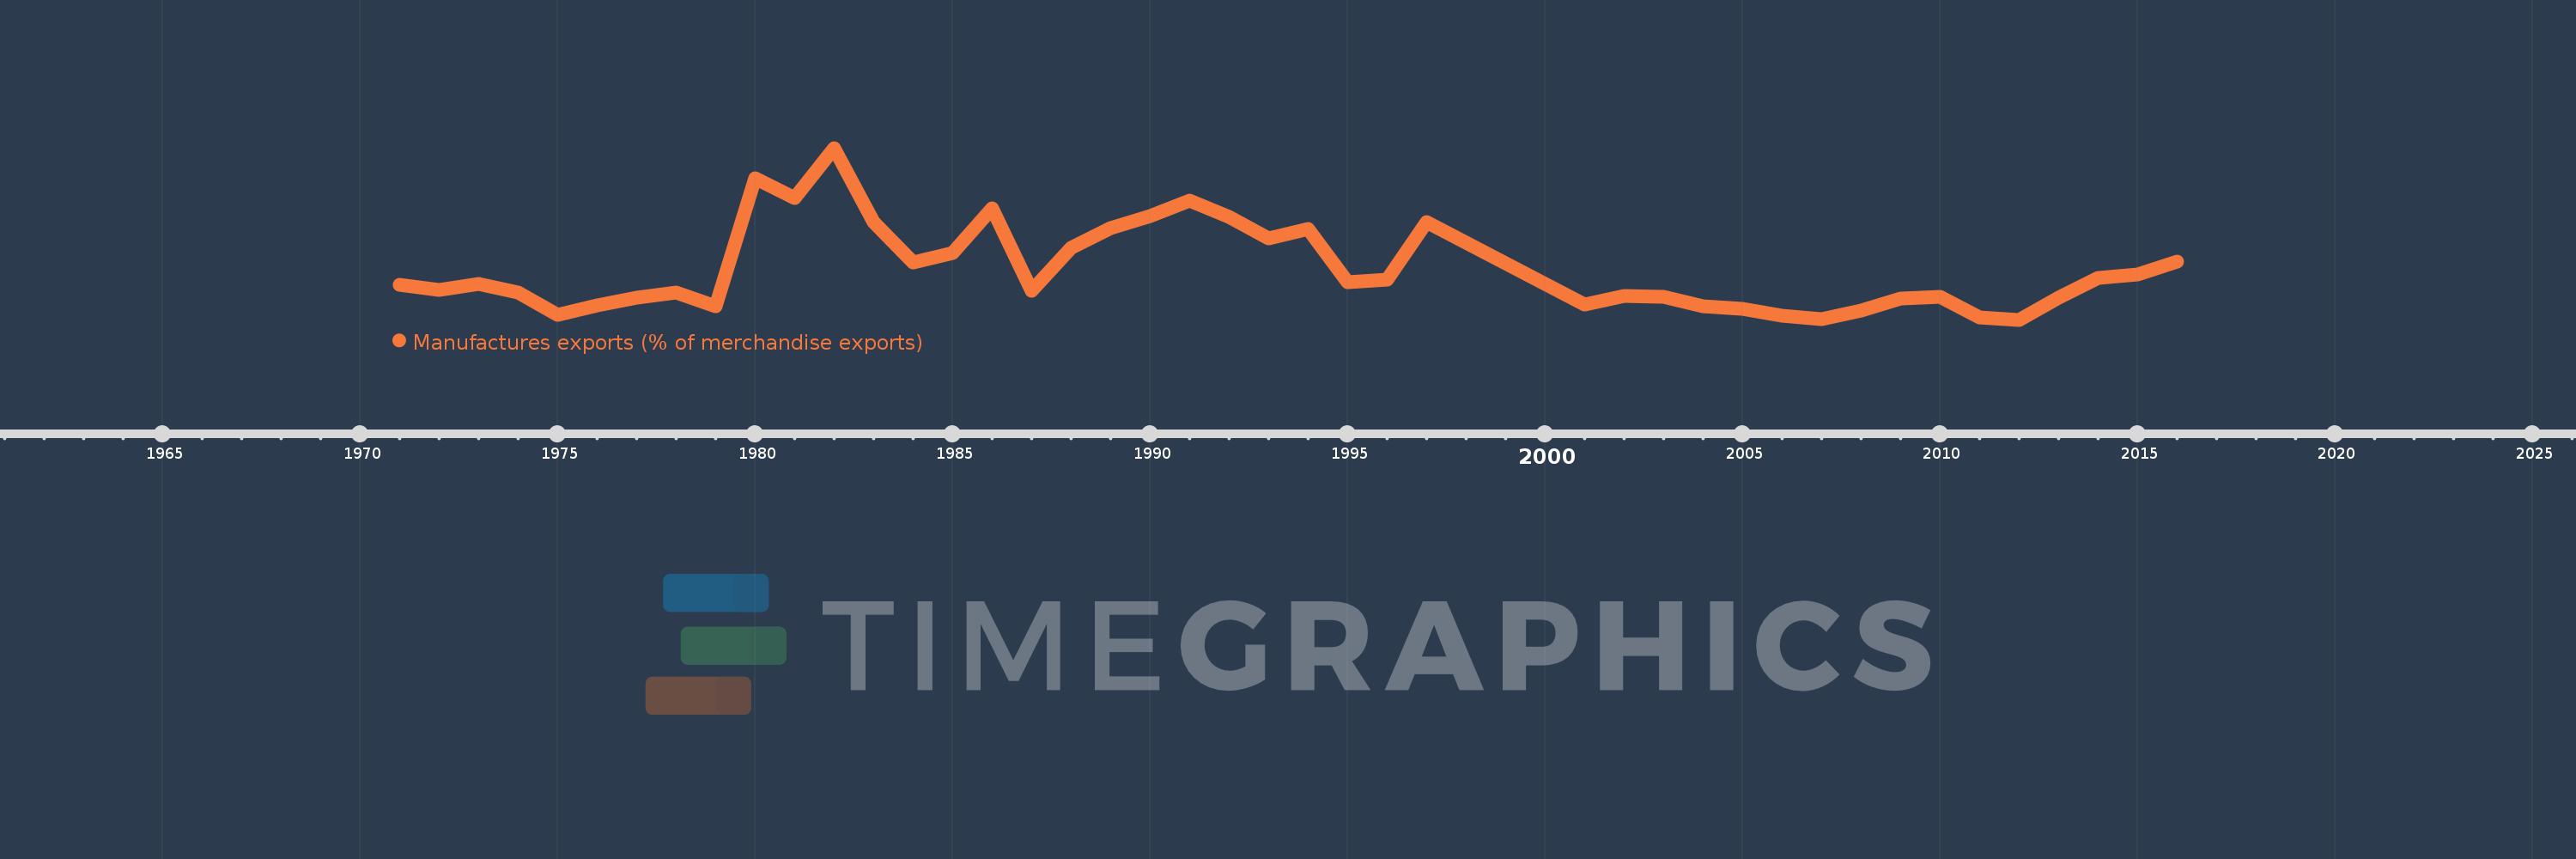
Manufactures exports (% of merchandise exports)
2016,2015,2014,2013,2012,2011,2010,2009,2008,2007,2006,2005,2004,2003,2002,2001,1997,1996,1995,1994,1993,1992,1991,1990,1989,1988,1987,1986,1985,1984,1983,1982,1981,1980,1979,1978,1977,1976,1975,1974,1973,1972,1971
This statistics in other country:
AfghanistanAlbaniaAlgeriaAndorraAngolaAntigua and BarbudaArab WorldArgentinaArmeniaArubaAustraliaAustriaAzerbaijanBahamas, TheBahrainBangladeshBarbadosBelarusBelgiumBelizeBeninBermudaBhutanBoliviaBosnia and HerzegovinaBotswanaBrazilBrunei DarussalamBulgariaBurkina FasoBurundiCabo VerdeCambodiaCameroonCanadaCaribbean small statesCayman IslandsCentral African RepublicCentral Europe and the BalticsChadChileChinaColombiaComorosCongo, Dem. Rep.Congo, Rep.Costa RicaCote d'IvoireCroatiaCubaCyprusCzech RepublicDenmarkDjiboutiDominicaDominican RepublicEarly-demographic dividendEast Asia & PacificEast Asia & Pacific (excluding high income)East Asia & Pacific (IDA & IBRD countries)EcuadorEgypt, Arab Rep.El SalvadorEquatorial GuineaEritreaEstoniaEthiopiaEuro areaEurope & Central AsiaEurope & Central Asia (excluding high income)Europe & Central Asia (IDA & IBRD countries)European UnionFaroe IslandsFijiFinlandFragile and conflict affected situationsFranceFrench PolynesiaGabonGambia, TheGeorgiaGermanyGhanaGreeceGreenlandGrenadaGuatemalaGuineaGuinea-BissauGuyanaHaitiHeavily indebted poor countries (HIPC)High incomeHondurasHong Kong SAR, ChinaHungaryIBRD onlyIcelandIDA & IBRD totalIDA blendIDA onlyIDA totalIndiaIndonesiaIran, Islamic Rep.IraqIrelandIsraelItalyJamaicaJapanJordanKazakhstanKenyaKiribatiKorea, Rep.KuwaitKyrgyz RepublicLao PDRLate-demographic dividendLatin America & Caribbean Latin America & Caribbean (excluding high income)Latin America & the Caribbean (IDA & IBRD countries)LatviaLeast developed countries: UN classificationLebanonLesothoLiberiaLibyaLithuaniaLow & middle incomeLower middle incomeLuxembourgMacao SAR, ChinaMacedonia, FYRMadagascarMalawiMalaysiaMaldivesMaliMaltaMauritaniaMauritiusMexicoMiddle East & North AfricaMiddle East & North Africa (excluding high income)Middle East & North Africa (IDA & IBRD countries)Middle incomeMoldovaMongoliaMoroccoMozambiqueMyanmarNamibiaNepalNetherlandsNew CaledoniaNew ZealandNicaraguaNigerNigeriaNorth AmericaNorwayOECD membersOmanOther small statesPacific island small statesPakistanPalauPanamaPapua New GuineaParaguayPeruPhilippinesPolandPortugalPost-demographic dividendPre-demographic dividendQatarRomaniaRussian FederationRwandaSamoaSao Tome and PrincipeSaudi ArabiaSenegalSerbiaSeychellesSierra LeoneSingaporeSlovak RepublicSloveniaSmall statesSolomon IslandsSomaliaSouth AfricaSouth AsiaSouth Asia (IDA & IBRD)SpainSri LankaSt. Kitts and NevisSt. LuciaSt. Vincent and the GrenadinesSub-Saharan Africa Sub-Saharan Africa (excluding high income)Sub-Saharan Africa (IDA & IBRD countries)SudanSurinameSwazilandSwedenSwitzerlandSyrian Arab RepublicTajikistanTanzaniaThailandTimor-LesteTogoTongaTrinidad and TobagoTunisiaTurkeyTurkmenistanTurks and Caicos IslandsTuvaluUgandaUkraineUnited Arab EmiratesUnited KingdomUnited StatesUpper middle incomeUruguayVanuatuVenezuela, RBVietnamVirgin Islands (U.S.)WorldYemen, Rep.ZambiaZimbabwe Timeline:
This timeline shows a graph from 1971 to 2016 of Bahrain. No data until 1970. Number of actual observations by date: 43.
Source name:
World Development Indicators
Source organization:
World Bank staff estimates from the Comtrade database maintained by the United Nations Statistics Division.
Categories, topics:
Private Sector, Trade
Last updated:
apr 23, 2017
Indicators value changes by year
Maximum:
61.445
jan 1, 1982
At the date of observation
Value
Absolute change
Change from previous value
jan 1, 1971
16.529
+16.529
0.0%
jan 1, 1972
14.835
-1.695
-10.25%
jan 1, 1973
16.733
+1.898
12.79%
jan 1, 1974
13.782
-2.95
-17.63%
jan 1, 1975
6.479
-7.304
-52.99%
jan 1, 1976
9.74
+3.261
50.34%
jan 1, 1977
12.245
+2.506
25.72%
jan 1, 1978
13.886
+1.641
13.4%
jan 1, 1979
9.475
-4.411
-31.77%
jan 1, 1980
51.412
+41.937
442.62%
jan 1, 1981
44.998
-6.413
-12.47%
jan 1, 1982
61.445
+16.446
36.55%
jan 1, 1983
36.956
-24.488
-39.85%
jan 1, 1984
23.787
-13.169
-35.63%
jan 1, 1985
26.931
+3.144
13.22%
jan 1, 1986
41.491
+14.56
54.06%
jan 1, 1987
14.444
-27.047
-65.19%
jan 1, 1988
28.528
+14.085
97.51%
jan 1, 1989
35.039
+6.51
22.82%
jan 1, 1990
38.966
+3.927
11.21%
jan 1, 1991
44.093
+5.127
13.16%
jan 1, 1992
38.718
-5.375
-12.19%
jan 1, 1993
31.656
-7.062
-18.24%
jan 1, 1994
34.893
+3.237
10.22%
jan 1, 1995
17.309
-17.584
-50.39%
jan 1, 1996
18.058
+0.749
4.33%
jan 1, 1997
37.025
+18.967
105.03%
jan 1, 2001
9.846
-27.179
-73.41%
jan 1, 2002
12.776
+2.93
29.76%
jan 1, 2003
12.49
-0.286
-2.24%
jan 1, 2004
9.436
-3.055
-24.46%
jan 1, 2005
8.543
-0.893
-9.46%
jan 1, 2006
6.138
-2.405
-28.15%
jan 1, 2007
5.194
-0.944
-15.38%
jan 1, 2008
7.956
+2.762
53.17%
jan 1, 2009
11.774
+3.818
48.0%
jan 1, 2010
12.58
+0.806
6.85%
jan 1, 2011
5.642
-6.938
-55.15%
jan 1, 2012
4.912
-0.73
-12.94%
jan 1, 2013
12.1
+7.188
146.32%
jan 1, 2014
18.593
+6.492
53.65%
jan 1, 2015
19.727
+1.134
6.1%
jan 1, 2016
23.92
+4.192
21.25%
Ranking of countries by current statistics by years


Comments: