29
/
en
AIzaSyAYiBZKx7MnpbEhh9jyipgxe19OcubqV5w
April 1, 2024
153768
Iceland
ISL
true
2
1
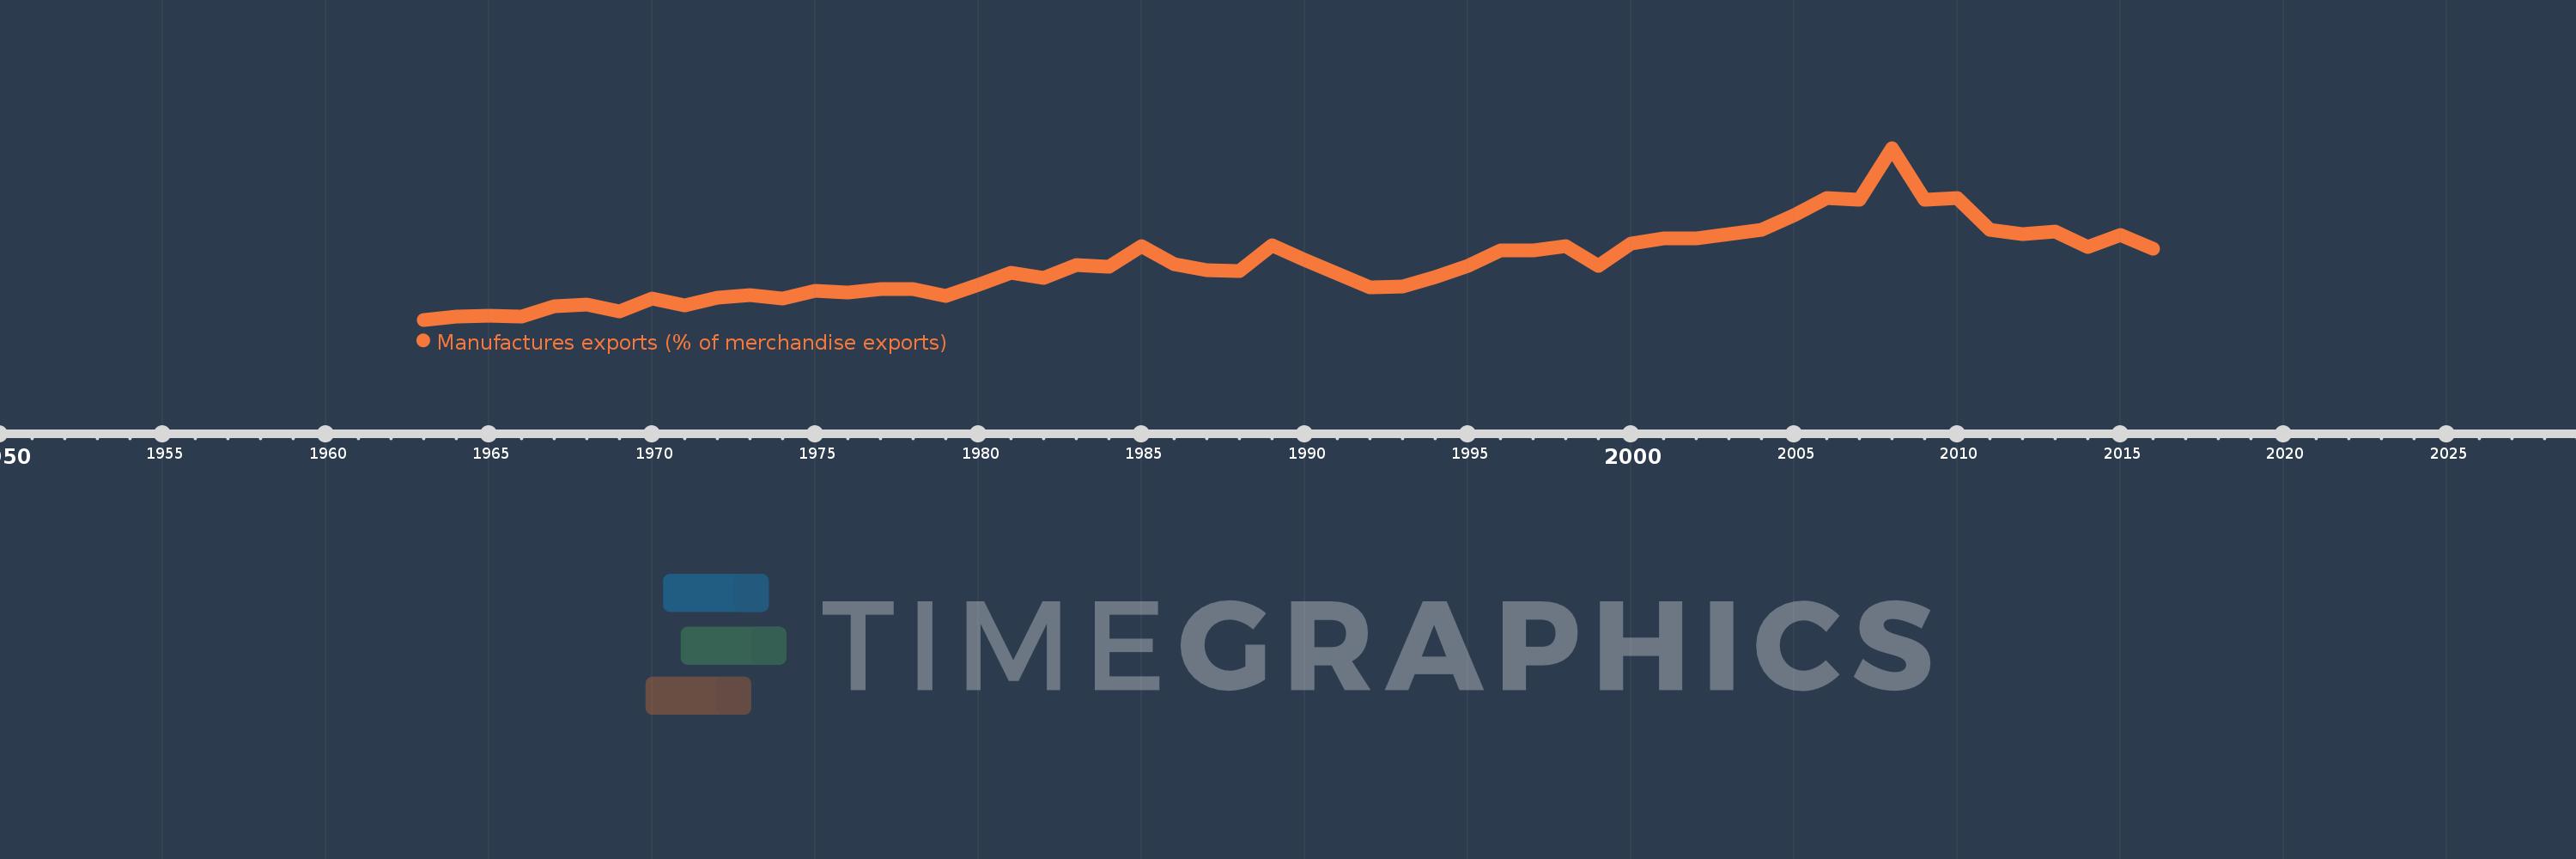
Manufactures exports (% of merchandise exports)
2016,2015,2014,2013,2012,2011,2010,2009,2008,2007,2006,2005,2004,2003,2002,2001,2000,1999,1998,1997,1996,1995,1994,1993,1992,1991,1990,1989,1988,1987,1986,1985,1984,1983,1982,1981,1980,1979,1978,1977,1976,1975,1974,1973,1972,1971,1970,1969,1968,1967,1966,1965,1964,1963
This statistics in other country:
AfghanistanAlbaniaAlgeriaAndorraAngolaAntigua and BarbudaArab WorldArgentinaArmeniaArubaAustraliaAustriaAzerbaijanBahamas, TheBahrainBangladeshBarbadosBelarusBelgiumBelizeBeninBermudaBhutanBoliviaBosnia and HerzegovinaBotswanaBrazilBrunei DarussalamBulgariaBurkina FasoBurundiCabo VerdeCambodiaCameroonCanadaCaribbean small statesCayman IslandsCentral African RepublicCentral Europe and the BalticsChadChileChinaColombiaComorosCongo, Dem. Rep.Congo, Rep.Costa RicaCote d'IvoireCroatiaCubaCyprusCzech RepublicDenmarkDjiboutiDominicaDominican RepublicEarly-demographic dividendEast Asia & PacificEast Asia & Pacific (excluding high income)East Asia & Pacific (IDA & IBRD countries)EcuadorEgypt, Arab Rep.El SalvadorEquatorial GuineaEritreaEstoniaEthiopiaEuro areaEurope & Central AsiaEurope & Central Asia (excluding high income)Europe & Central Asia (IDA & IBRD countries)European UnionFaroe IslandsFijiFinlandFragile and conflict affected situationsFranceFrench PolynesiaGabonGambia, TheGeorgiaGermanyGhanaGreeceGreenlandGrenadaGuatemalaGuineaGuinea-BissauGuyanaHaitiHeavily indebted poor countries (HIPC)High incomeHondurasHong Kong SAR, ChinaHungaryIBRD onlyIcelandIDA & IBRD totalIDA blendIDA onlyIDA totalIndiaIndonesiaIran, Islamic Rep.IraqIrelandIsraelItalyJamaicaJapanJordanKazakhstanKenyaKiribatiKorea, Rep.KuwaitKyrgyz RepublicLao PDRLate-demographic dividendLatin America & Caribbean Latin America & Caribbean (excluding high income)Latin America & the Caribbean (IDA & IBRD countries)LatviaLeast developed countries: UN classificationLebanonLesothoLiberiaLibyaLithuaniaLow & middle incomeLower middle incomeLuxembourgMacao SAR, ChinaMacedonia, FYRMadagascarMalawiMalaysiaMaldivesMaliMaltaMauritaniaMauritiusMexicoMiddle East & North AfricaMiddle East & North Africa (excluding high income)Middle East & North Africa (IDA & IBRD countries)Middle incomeMoldovaMongoliaMoroccoMozambiqueMyanmarNamibiaNepalNetherlandsNew CaledoniaNew ZealandNicaraguaNigerNigeriaNorth AmericaNorwayOECD membersOmanOther small statesPacific island small statesPakistanPalauPanamaPapua New GuineaParaguayPeruPhilippinesPolandPortugalPost-demographic dividendPre-demographic dividendQatarRomaniaRussian FederationRwandaSamoaSao Tome and PrincipeSaudi ArabiaSenegalSerbiaSeychellesSierra LeoneSingaporeSlovak RepublicSloveniaSmall statesSolomon IslandsSomaliaSouth AfricaSouth AsiaSouth Asia (IDA & IBRD)SpainSri LankaSt. Kitts and NevisSt. LuciaSt. Vincent and the GrenadinesSub-Saharan Africa Sub-Saharan Africa (excluding high income)Sub-Saharan Africa (IDA & IBRD countries)SudanSurinameSwazilandSwedenSwitzerlandSyrian Arab RepublicTajikistanTanzaniaThailandTimor-LesteTogoTongaTrinidad and TobagoTunisiaTurkeyTurkmenistanTurks and Caicos IslandsTuvaluUgandaUkraineUnited Arab EmiratesUnited KingdomUnited StatesUpper middle incomeUruguayVanuatuVenezuela, RBVietnamVirgin Islands (U.S.)WorldYemen, Rep.ZambiaZimbabwe Timeline:
This timeline shows a graph from 1963 to 2016 of Iceland. No data until 1962. Number of actual observations by date: 54.
Source name:
World Development Indicators
Source organization:
World Bank staff estimates from the Comtrade database maintained by the United Nations Statistics Division.
Categories, topics:
Private Sector, Trade
Last updated:
apr 23, 2017
Indicators value changes by year
Maximum:
26.749
jan 1, 2008
At the date of observation
Value
Absolute change
Change from previous value
jan 1, 1963
1.21
+1.21
0.0%
jan 1, 1964
1.71
+0.5
41.31%
jan 1, 1965
1.857
+0.147
8.59%
jan 1, 1966
1.663
-0.194
-10.45%
jan 1, 1967
3.231
+1.568
94.26%
jan 1, 1968
3.519
+0.288
8.92%
jan 1, 1969
2.505
-1.014
-28.81%
jan 1, 1970
4.352
+1.847
73.71%
jan 1, 1971
3.299
-1.053
-24.19%
jan 1, 1972
4.446
+1.146
34.75%
jan 1, 1973
4.869
+0.424
9.53%
jan 1, 1974
4.365
-0.504
-10.35%
jan 1, 1975
5.523
+1.158
26.52%
jan 1, 1976
5.279
-0.244
-4.41%
jan 1, 1977
5.762
+0.482
9.13%
jan 1, 1978
5.819
+0.058
1.0%
jan 1, 1979
4.704
-1.115
-19.17%
jan 1, 1980
6.379
+1.675
35.6%
jan 1, 1981
8.166
+1.787
28.02%
jan 1, 1982
7.478
-0.688
-8.42%
jan 1, 1983
9.298
+1.82
24.34%
jan 1, 1984
9.081
-0.217
-2.33%
jan 1, 1985
12.135
+3.054
33.63%
jan 1, 1986
9.429
-2.707
-22.3%
jan 1, 1987
8.533
-0.896
-9.5%
jan 1, 1988
8.426
-0.107
-1.25%
jan 1, 1989
12.236
+3.81
45.21%
jan 1, 1990
10.144
-2.092
-17.1%
jan 1, 1991
8.006
-2.138
-21.07%
jan 1, 1992
6.035
-1.971
-24.62%
jan 1, 1993
6.187
+0.152
2.52%
jan 1, 1994
7.508
+1.322
21.36%
jan 1, 1995
9.22
+1.712
22.8%
jan 1, 1996
11.577
+2.357
25.56%
jan 1, 1997
11.497
-0.08
-0.69%
jan 1, 1998
12.139
+0.642
5.58%
jan 1, 1999
9.178
-2.962
-24.4%
jan 1, 2000
12.522
+3.344
36.43%
jan 1, 2001
13.269
+0.747
5.97%
jan 1, 2002
13.278
+0.009
0.07%
jan 1, 2003
13.954
+0.676
5.09%
jan 1, 2004
14.549
+0.595
4.26%
jan 1, 2005
16.729
+2.18
14.98%
jan 1, 2006
19.299
+2.57
15.36%
jan 1, 2007
19.055
-0.244
-1.27%
jan 1, 2008
26.749
+7.694
40.38%
jan 1, 2009
19.05
-7.699
-28.78%
jan 1, 2010
19.26
+0.209
1.1%
jan 1, 2011
14.626
-4.634
-24.06%
jan 1, 2012
14.004
-0.622
-4.25%
jan 1, 2013
14.279
+0.275
1.97%
jan 1, 2014
12.077
-2.202
-15.42%
jan 1, 2015
13.837
+1.76
14.57%
jan 1, 2016
11.727
-2.111
-15.25%
Ranking of countries by current statistics by years


Comments: