29
/
en
AIzaSyAYiBZKx7MnpbEhh9jyipgxe19OcubqV5w
April 1, 2024
90757
Brazil
BRA
true
2
1
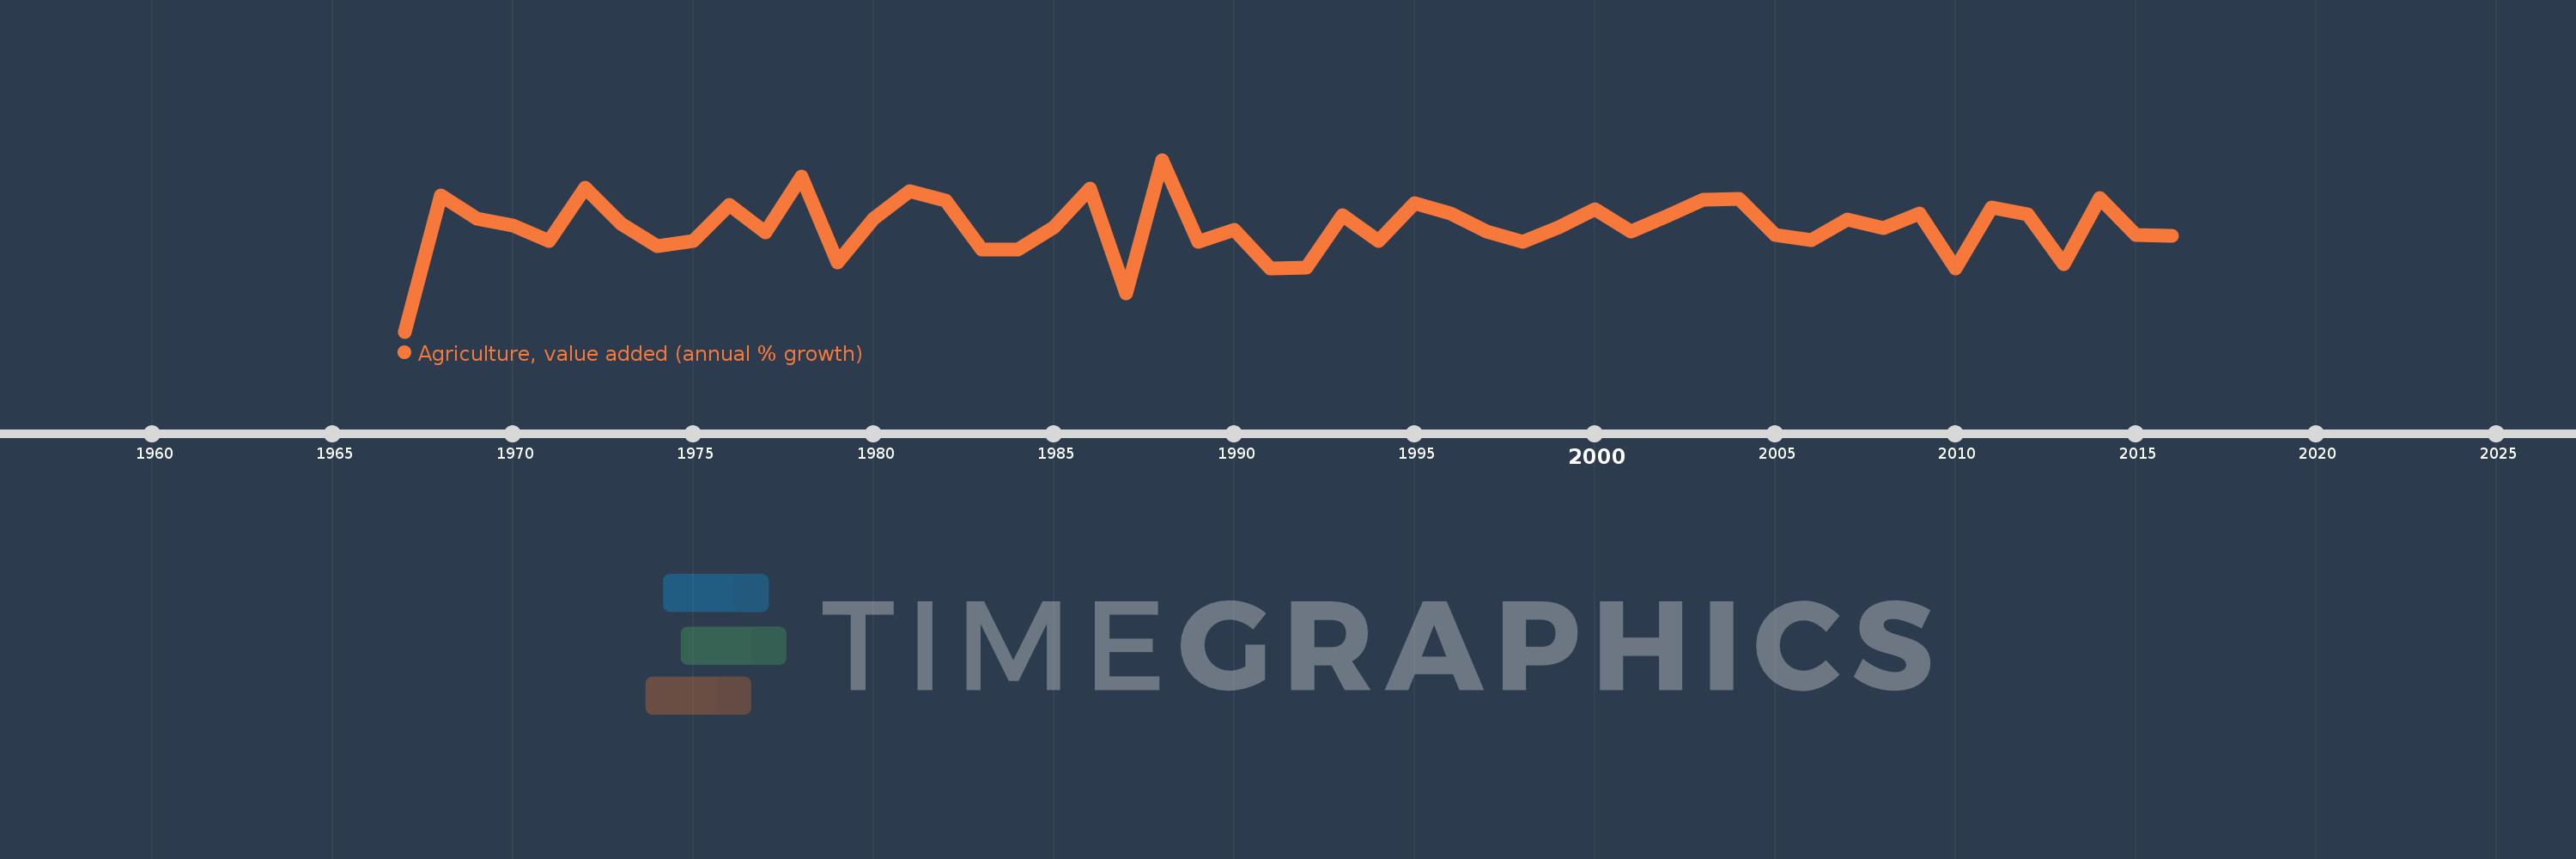
Agriculture, value added (annual % growth)
2016,2015,2014,2013,2012,2011,2010,2009,2008,2007,2006,2005,2004,2003,2002,2001,2000,1999,1998,1997,1996,1995,1994,1993,1992,1991,1990,1989,1988,1987,1986,1985,1984,1983,1982,1981,1980,1979,1978,1977,1976,1975,1974,1973,1972,1971,1970,1969,1968,1967
This statistics in other country:
AfghanistanAlbaniaAlgeriaAntigua and BarbudaArab WorldArgentinaArmeniaAustraliaAustriaAzerbaijanBahamas, TheBahrainBangladeshBelarusBelgiumBelizeBeninBermudaBhutanBoliviaBosnia and HerzegovinaBotswanaBrazilBrunei DarussalamBulgariaBurkina FasoBurundiCabo VerdeCambodiaCameroonCanadaCaribbean small statesCayman IslandsCentral African RepublicCentral Europe and the BalticsChadChileChinaColombiaComorosCongo, Dem. Rep.Congo, Rep.Costa RicaCote d'IvoireCroatiaCubaCyprusCzech RepublicDenmarkDjiboutiDominicaDominican RepublicEarly-demographic dividendEast Asia & PacificEast Asia & Pacific (excluding high income)East Asia & Pacific (IDA & IBRD countries)EcuadorEgypt, Arab Rep.El SalvadorEquatorial GuineaEritreaEstoniaEthiopiaEuro areaEurope & Central AsiaEurope & Central Asia (excluding high income)Europe & Central Asia (IDA & IBRD countries)European UnionFijiFinlandFragile and conflict affected situationsFranceGabonGambia, TheGeorgiaGermanyGhanaGreeceGrenadaGuatemalaGuineaGuinea-BissauGuyanaHaitiHeavily indebted poor countries (HIPC)High incomeHondurasHong Kong SAR, ChinaHungaryIBRD onlyIcelandIDA & IBRD totalIDA blendIDA onlyIDA totalIndiaIndonesiaIran, Islamic Rep.IraqIrelandItalyJamaicaJapanJordanKazakhstanKenyaKiribatiKorea, Rep.KosovoKuwaitKyrgyz RepublicLao PDRLate-demographic dividendLatin America & Caribbean Latin America & Caribbean (excluding high income)Latin America & the Caribbean (IDA & IBRD countries)LatviaLeast developed countries: UN classificationLebanonLesothoLiberiaLithuaniaLow & middle incomeLow incomeLower middle incomeLuxembourgMacedonia, FYRMadagascarMalawiMalaysiaMaldivesMaliMarshall IslandsMauritaniaMauritiusMexicoMicronesia, Fed. Sts.Middle East & North AfricaMiddle East & North Africa (excluding high income)Middle East & North Africa (IDA & IBRD countries)Middle incomeMoldovaMongoliaMontenegroMoroccoMozambiqueMyanmarNamibiaNepalNetherlandsNew ZealandNicaraguaNigerNigeriaNorth AmericaNorwayOECD membersOmanOther small statesPakistanPalauPanamaPapua New GuineaParaguayPeruPhilippinesPolandPortugalPost-demographic dividendPre-demographic dividendPuerto RicoQatarRomaniaRussian FederationRwandaSamoaSao Tome and PrincipeSaudi ArabiaSenegalSerbiaSeychellesSierra LeoneSingaporeSlovak RepublicSloveniaSmall statesSolomon IslandsSomaliaSouth AfricaSouth AsiaSouth Asia (IDA & IBRD)SpainSri LankaSt. Kitts and NevisSt. LuciaSt. Vincent and the GrenadinesSub-Saharan Africa Sub-Saharan Africa (excluding high income)Sub-Saharan Africa (IDA & IBRD countries)SudanSurinameSwazilandSwedenSwitzerlandSyrian Arab RepublicTajikistanTanzaniaThailandTimor-LesteTogoTongaTrinidad and TobagoTunisiaTurkeyTurkmenistanTuvaluUgandaUkraineUnited Arab EmiratesUnited KingdomUnited StatesUpper middle incomeUruguayUzbekistanVanuatuVenezuela, RBVietnamWest Bank and GazaWorldZambiaZimbabwe Timeline:
This timeline shows a graph from 1967 to 2016 of Brazil. No data until 1966. Number of actual observations by date: 50.
Source name:
World Development Indicators
Source organization:
World Bank national accounts data, and OECD National Accounts data files.
Categories, topics:
Economy & Growth
Last updated:
apr 23, 2017
Indicators value changes by year
Minimum:
-14.647
jan 1, 1967
Maximum:
14.972
jan 1, 1988
At the date of observation
Value
Absolute change
Change from previous value
jan 1, 1967
-14.647
-14.647
0.0%
jan 1, 1968
8.876
+23.522
-160.6%
jan 1, 1969
4.891
-3.985
-44.89%
jan 1, 1970
3.627
-1.264
-25.85%
jan 1, 1971
1.0
-2.627
-72.43%
jan 1, 1972
10.157
+9.157
915.68%
jan 1, 1973
3.97
-6.187
-60.91%
jan 1, 1974
0.03
-3.94
-99.24%
jan 1, 1975
0.99
+0.96
3.19K%
jan 1, 1976
7.21
+6.22
628.3%
jan 1, 1977
2.44
-4.77
-66.16%
jan 1, 1978
12.13
+9.69
397.11%
jan 1, 1979
-2.774
-14.904
-122.87%
jan 1, 1980
4.769
+7.543
-271.93%
jan 1, 1981
9.549
+4.78
100.22%
jan 1, 1982
7.97
-1.579
-16.54%
jan 1, 1983
-0.491
-8.461
-106.16%
jan 1, 1984
-0.577
-0.086
17.59%
jan 1, 1985
3.37
+3.947
-683.9%
jan 1, 1986
9.963
+6.593
195.65%
jan 1, 1987
-8.022
-17.985
-180.52%
jan 1, 1988
14.972
+22.994
-286.63%
jan 1, 1989
0.841
-14.131
-94.39%
jan 1, 1990
2.85
+2.01
239.07%
jan 1, 1991
-3.7
-6.551
-229.82%
jan 1, 1992
-3.603
+0.097
-2.63%
jan 1, 1993
5.437
+9.04
-250.91%
jan 1, 1994
0.987
-4.451
-81.85%
jan 1, 1995
7.441
+6.454
654.19%
jan 1, 1996
5.736
-1.705
-22.91%
jan 1, 1997
2.543
-3.193
-55.66%
jan 1, 1998
0.813
-1.73
-68.02%
jan 1, 1999
3.411
+2.597
319.28%
jan 1, 2000
6.524
+3.114
91.29%
jan 1, 2001
2.634
-3.891
-59.63%
jan 1, 2002
5.291
+2.657
100.9%
jan 1, 2003
8.021
+2.73
51.59%
jan 1, 2004
8.306
+0.285
3.55%
jan 1, 2005
1.996
-6.31
-75.97%
jan 1, 2006
1.121
-0.875
-43.84%
jan 1, 2007
4.638
+3.517
313.82%
jan 1, 2008
3.247
-1.391
-30.0%
jan 1, 2009
5.773
+2.526
77.79%
jan 1, 2010
-3.73
-9.503
-164.62%
jan 1, 2011
6.698
+10.428
-279.55%
jan 1, 2012
5.637
-1.06
-15.83%
jan 1, 2013
-3.082
-8.719
-154.67%
jan 1, 2014
8.363
+11.445
-371.33%
jan 1, 2015
2.081
-6.282
-75.12%
jan 1, 2016
1.832
-0.249
-11.98%
Ranking of countries by current statistics by years


Comments: