29
/
en
AIzaSyAYiBZKx7MnpbEhh9jyipgxe19OcubqV5w
April 1, 2024
147633
Guyana
GUY
true
2
1
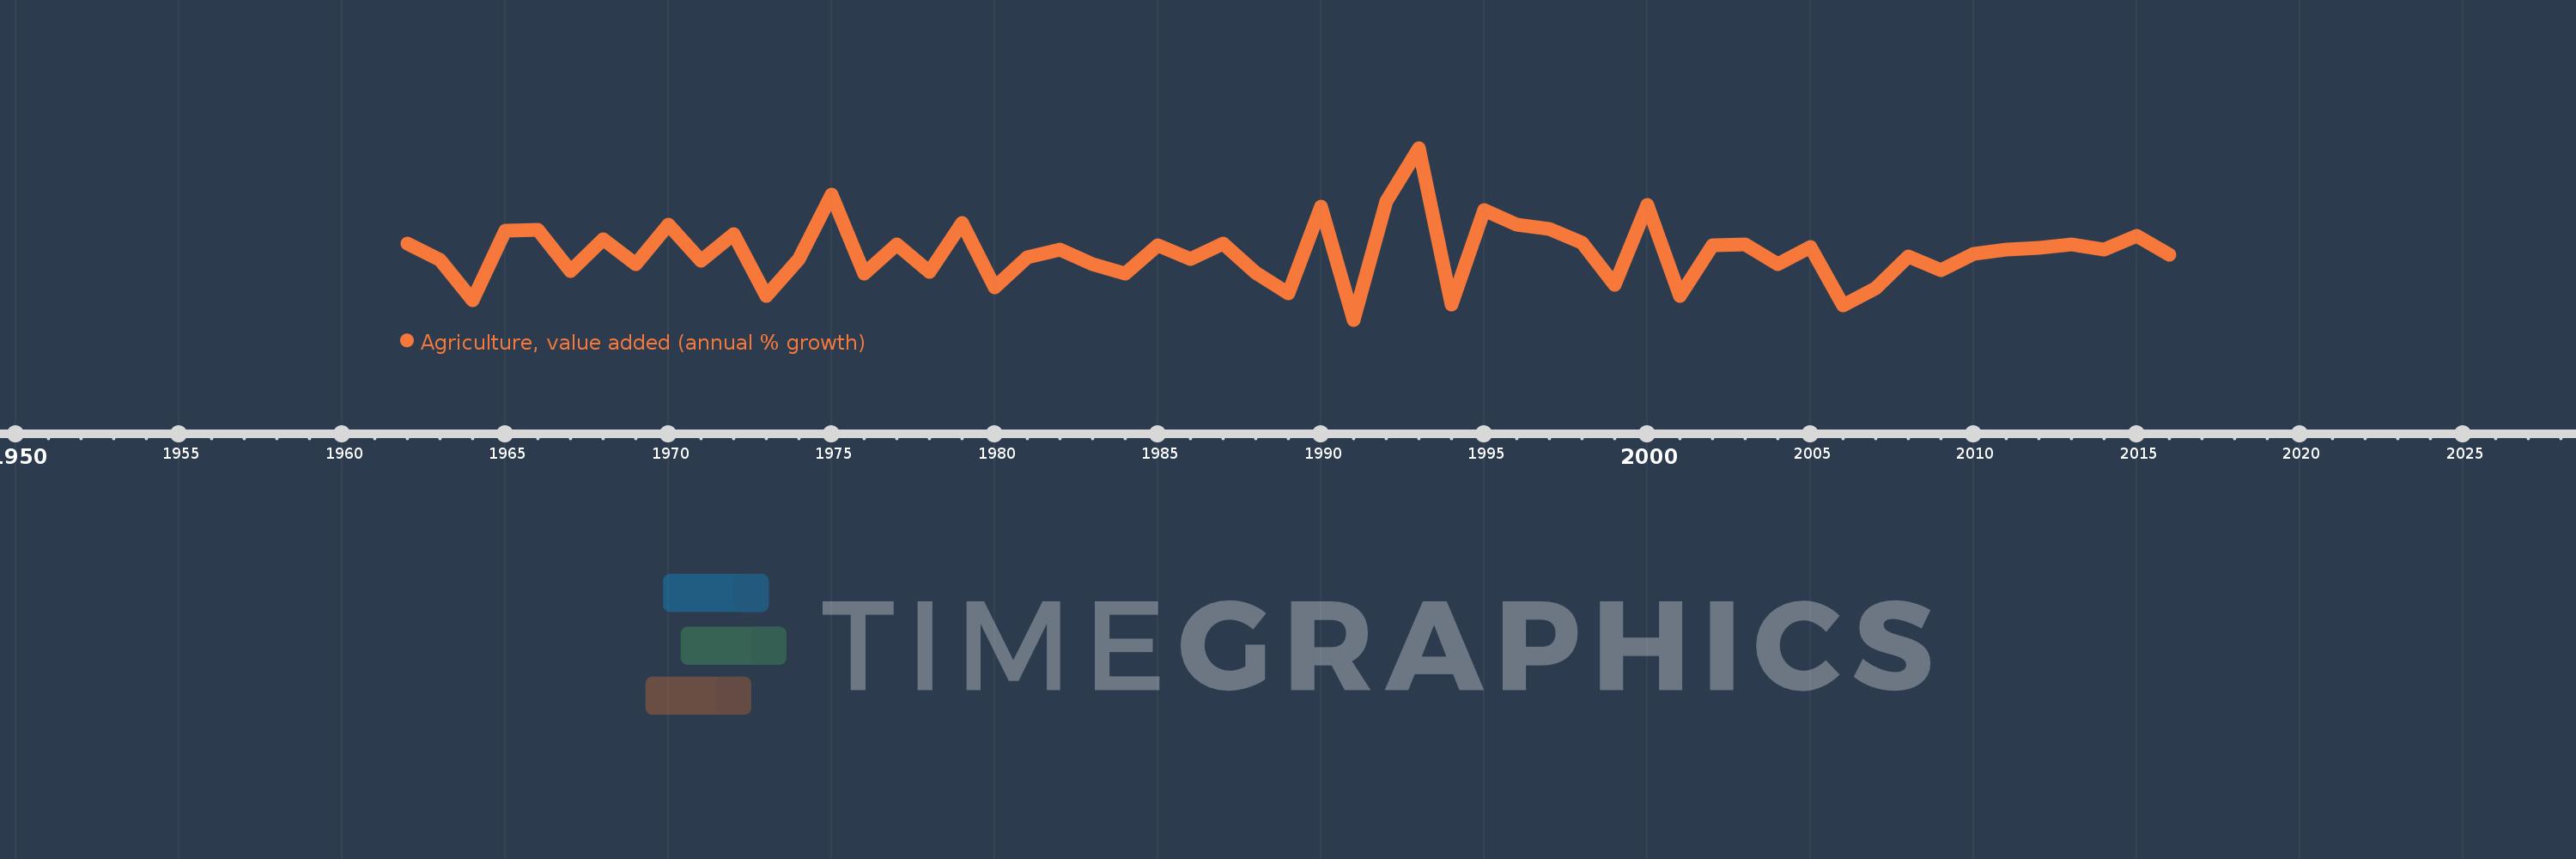
Agriculture, value added (annual % growth)
2016,2015,2014,2013,2012,2011,2010,2009,2008,2007,2006,2005,2004,2003,2002,2001,2000,1999,1998,1997,1996,1995,1994,1993,1992,1991,1990,1989,1988,1987,1986,1985,1984,1983,1982,1981,1980,1979,1978,1977,1976,1975,1974,1973,1972,1971,1970,1969,1968,1967,1966,1965,1964,1963,1962
This statistics in other country:
AfghanistanAlbaniaAlgeriaAntigua and BarbudaArab WorldArgentinaArmeniaAustraliaAustriaAzerbaijanBahamas, TheBahrainBangladeshBelarusBelgiumBelizeBeninBermudaBhutanBoliviaBosnia and HerzegovinaBotswanaBrazilBrunei DarussalamBulgariaBurkina FasoBurundiCabo VerdeCambodiaCameroonCanadaCaribbean small statesCayman IslandsCentral African RepublicCentral Europe and the BalticsChadChileChinaColombiaComorosCongo, Dem. Rep.Congo, Rep.Costa RicaCote d'IvoireCroatiaCubaCyprusCzech RepublicDenmarkDjiboutiDominicaDominican RepublicEarly-demographic dividendEast Asia & PacificEast Asia & Pacific (excluding high income)East Asia & Pacific (IDA & IBRD countries)EcuadorEgypt, Arab Rep.El SalvadorEquatorial GuineaEritreaEstoniaEthiopiaEuro areaEurope & Central AsiaEurope & Central Asia (excluding high income)Europe & Central Asia (IDA & IBRD countries)European UnionFijiFinlandFragile and conflict affected situationsFranceGabonGambia, TheGeorgiaGermanyGhanaGreeceGrenadaGuatemalaGuineaGuinea-BissauGuyanaHaitiHeavily indebted poor countries (HIPC)High incomeHondurasHong Kong SAR, ChinaHungaryIBRD onlyIcelandIDA & IBRD totalIDA blendIDA onlyIDA totalIndiaIndonesiaIran, Islamic Rep.IraqIrelandItalyJamaicaJapanJordanKazakhstanKenyaKiribatiKorea, Rep.KosovoKuwaitKyrgyz RepublicLao PDRLate-demographic dividendLatin America & Caribbean Latin America & Caribbean (excluding high income)Latin America & the Caribbean (IDA & IBRD countries)LatviaLeast developed countries: UN classificationLebanonLesothoLiberiaLithuaniaLow & middle incomeLow incomeLower middle incomeLuxembourgMacedonia, FYRMadagascarMalawiMalaysiaMaldivesMaliMarshall IslandsMauritaniaMauritiusMexicoMicronesia, Fed. Sts.Middle East & North AfricaMiddle East & North Africa (excluding high income)Middle East & North Africa (IDA & IBRD countries)Middle incomeMoldovaMongoliaMontenegroMoroccoMozambiqueMyanmarNamibiaNepalNetherlandsNew ZealandNicaraguaNigerNigeriaNorth AmericaNorwayOECD membersOmanOther small statesPakistanPalauPanamaPapua New GuineaParaguayPeruPhilippinesPolandPortugalPost-demographic dividendPre-demographic dividendPuerto RicoQatarRomaniaRussian FederationRwandaSamoaSao Tome and PrincipeSaudi ArabiaSenegalSerbiaSeychellesSierra LeoneSingaporeSlovak RepublicSloveniaSmall statesSolomon IslandsSomaliaSouth AfricaSouth AsiaSouth Asia (IDA & IBRD)SpainSri LankaSt. Kitts and NevisSt. LuciaSt. Vincent and the GrenadinesSub-Saharan Africa Sub-Saharan Africa (excluding high income)Sub-Saharan Africa (IDA & IBRD countries)SudanSurinameSwazilandSwedenSwitzerlandSyrian Arab RepublicTajikistanTanzaniaThailandTimor-LesteTogoTongaTrinidad and TobagoTunisiaTurkeyTurkmenistanTuvaluUgandaUkraineUnited Arab EmiratesUnited KingdomUnited StatesUpper middle incomeUruguayUzbekistanVanuatuVenezuela, RBVietnamWest Bank and GazaWorldZambiaZimbabwe Timeline:
This timeline shows a graph from 1962 to 2016 of Guyana. No data until 1961. Number of actual observations by date: 55.
Source name:
World Development Indicators
Source organization:
World Bank national accounts data, and OECD National Accounts data files.
Categories, topics:
Economy & Growth
Last updated:
apr 23, 2017
Indicators value changes by year
Minimum:
-15.123
jan 1, 1991
Maximum:
27.485
jan 1, 1993
At the date of observation
Value
Absolute change
Change from previous value
jan 1, 1962
3.782
+3.782
0.0%
jan 1, 1963
-0.287
-4.069
-107.58%
jan 1, 1964
-10.21
-9.923
3.46K%
jan 1, 1965
7.047
+17.256
-169.02%
jan 1, 1966
7.119
+0.072
1.02%
jan 1, 1967
-3.096
-10.215
-143.49%
jan 1, 1968
4.744
+7.84
-253.24%
jan 1, 1969
-1.319
-6.063
-127.8%
jan 1, 1970
8.413
+9.731
-737.98%
jan 1, 1971
-0.568
-8.981
-106.75%
jan 1, 1972
6.155
+6.723
-1.18K%
jan 1, 1973
-9.18
-15.335
-249.14%
jan 1, 1974
0.0
+9.18
-100.0%
jan 1, 1975
15.966
+15.966
%
jan 1, 1976
-3.673
-19.639
-123.01%
jan 1, 1977
3.573
+7.247
-197.27%
jan 1, 1978
-3.218
-6.791
-190.06%
jan 1, 1979
8.787
+12.005
-373.05%
jan 1, 1980
-6.985
-15.772
-179.49%
jan 1, 1981
0.464
+7.449
-106.64%
jan 1, 1982
2.338
+1.874
404.05%
jan 1, 1983
-1.372
-3.71
-158.71%
jan 1, 1984
-3.698
-2.325
169.43%
jan 1, 1985
3.365
+7.063
-191.0%
jan 1, 1986
0.0
-3.365
-100.0%
jan 1, 1987
3.715
+3.715
%
jan 1, 1988
-3.572
-7.287
-196.16%
jan 1, 1989
-8.504
-4.932
138.06%
jan 1, 1990
13.034
+21.539
-253.26%
jan 1, 1991
-15.123
-28.157
-216.02%
jan 1, 1992
14.254
+29.377
-194.25%
jan 1, 1993
27.485
+13.231
92.83%
jan 1, 1994
-11.315
-38.8
-141.17%
jan 1, 1995
12.155
+23.47
-207.43%
jan 1, 1996
8.532
-3.623
-29.81%
jan 1, 1997
7.365
-1.166
-13.67%
jan 1, 1998
3.958
-3.408
-46.27%
jan 1, 1999
-6.472
-10.43
-263.53%
jan 1, 2000
13.433
+19.905
-307.55%
jan 1, 2001
-9.151
-22.584
-168.12%
jan 1, 2002
3.423
+12.574
-137.41%
jan 1, 2003
3.501
+0.078
2.27%
jan 1, 2004
-1.278
-4.779
-136.5%
jan 1, 2005
2.883
+4.161
-325.62%
jan 1, 2006
-11.535
-14.418
-500.12%
jan 1, 2007
-7.238
+4.297
-37.26%
jan 1, 2008
0.561
+7.798
-107.75%
jan 1, 2009
-2.932
-3.493
-622.92%
jan 1, 2010
1.273
+4.205
-143.41%
jan 1, 2011
2.343
+1.07
84.07%
jan 1, 2012
2.653
+0.31
13.23%
jan 1, 2013
3.65
+0.997
37.6%
jan 1, 2014
2.326
-1.324
-36.28%
jan 1, 2015
5.64
+3.314
142.45%
jan 1, 2016
1.109
-4.531
-80.34%
Ranking of countries by current statistics by years


Comments: