29
/
en
AIzaSyAYiBZKx7MnpbEhh9jyipgxe19OcubqV5w
April 1, 2024
167097
Kenya
KEN
true
2
1
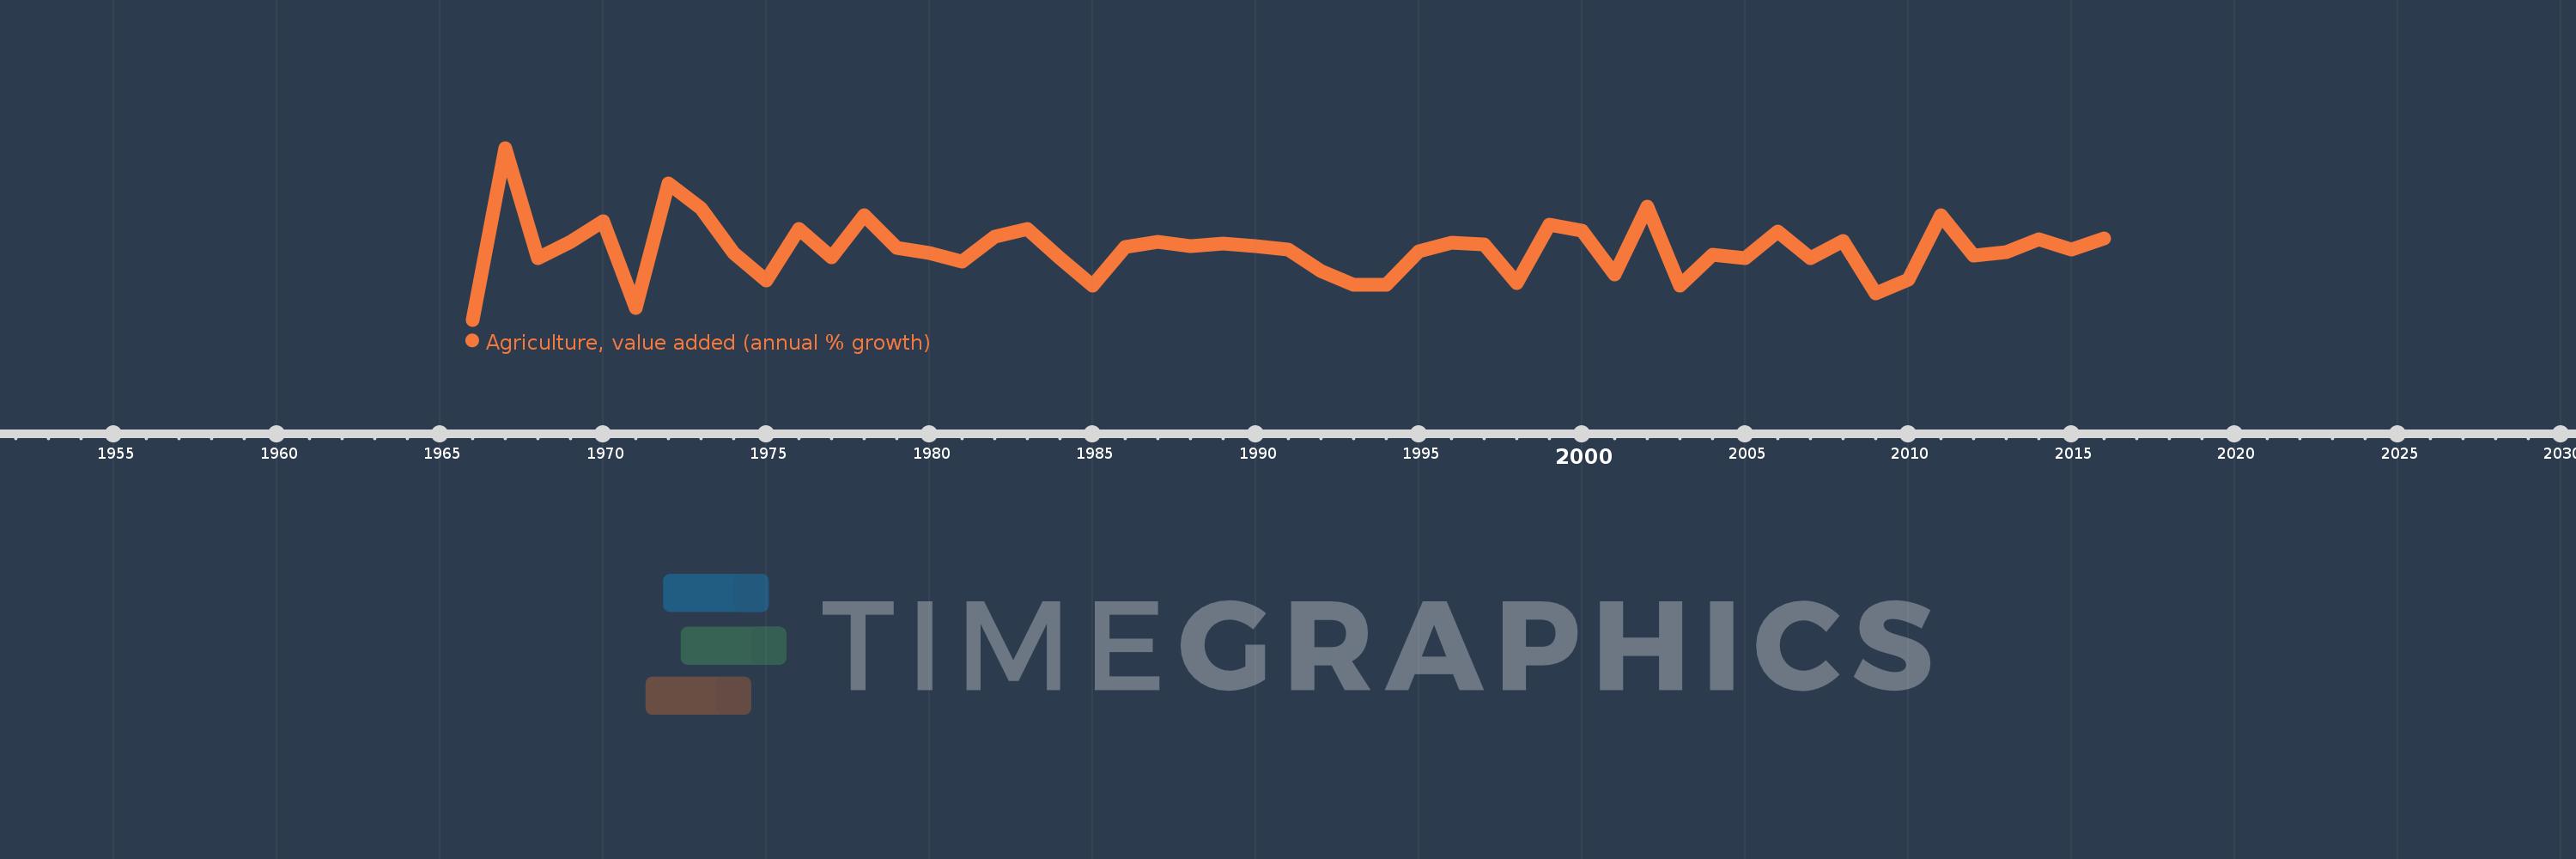
Agriculture, value added (annual % growth)
2016,2015,2014,2013,2012,2011,2010,2009,2008,2007,2006,2005,2004,2003,2002,2001,2000,1999,1998,1997,1996,1995,1994,1993,1992,1991,1990,1989,1988,1987,1986,1985,1984,1983,1982,1981,1980,1979,1978,1977,1976,1975,1974,1973,1972,1971,1970,1969,1968,1967,1966
This statistics in other country:
AfghanistanAlbaniaAlgeriaAntigua and BarbudaArab WorldArgentinaArmeniaAustraliaAustriaAzerbaijanBahamas, TheBahrainBangladeshBelarusBelgiumBelizeBeninBermudaBhutanBoliviaBosnia and HerzegovinaBotswanaBrazilBrunei DarussalamBulgariaBurkina FasoBurundiCabo VerdeCambodiaCameroonCanadaCaribbean small statesCayman IslandsCentral African RepublicCentral Europe and the BalticsChadChileChinaColombiaComorosCongo, Dem. Rep.Congo, Rep.Costa RicaCote d'IvoireCroatiaCubaCyprusCzech RepublicDenmarkDjiboutiDominicaDominican RepublicEarly-demographic dividendEast Asia & PacificEast Asia & Pacific (excluding high income)East Asia & Pacific (IDA & IBRD countries)EcuadorEgypt, Arab Rep.El SalvadorEquatorial GuineaEritreaEstoniaEthiopiaEuro areaEurope & Central AsiaEurope & Central Asia (excluding high income)Europe & Central Asia (IDA & IBRD countries)European UnionFijiFinlandFragile and conflict affected situationsFranceGabonGambia, TheGeorgiaGermanyGhanaGreeceGrenadaGuatemalaGuineaGuinea-BissauGuyanaHaitiHeavily indebted poor countries (HIPC)High incomeHondurasHong Kong SAR, ChinaHungaryIBRD onlyIcelandIDA & IBRD totalIDA blendIDA onlyIDA totalIndiaIndonesiaIran, Islamic Rep.IraqIrelandItalyJamaicaJapanJordanKazakhstanKenyaKiribatiKorea, Rep.KosovoKuwaitKyrgyz RepublicLao PDRLate-demographic dividendLatin America & Caribbean Latin America & Caribbean (excluding high income)Latin America & the Caribbean (IDA & IBRD countries)LatviaLeast developed countries: UN classificationLebanonLesothoLiberiaLithuaniaLow & middle incomeLow incomeLower middle incomeLuxembourgMacedonia, FYRMadagascarMalawiMalaysiaMaldivesMaliMarshall IslandsMauritaniaMauritiusMexicoMicronesia, Fed. Sts.Middle East & North AfricaMiddle East & North Africa (excluding high income)Middle East & North Africa (IDA & IBRD countries)Middle incomeMoldovaMongoliaMontenegroMoroccoMozambiqueMyanmarNamibiaNepalNetherlandsNew ZealandNicaraguaNigerNigeriaNorth AmericaNorwayOECD membersOmanOther small statesPakistanPalauPanamaPapua New GuineaParaguayPeruPhilippinesPolandPortugalPost-demographic dividendPre-demographic dividendPuerto RicoQatarRomaniaRussian FederationRwandaSamoaSao Tome and PrincipeSaudi ArabiaSenegalSerbiaSeychellesSierra LeoneSingaporeSlovak RepublicSloveniaSmall statesSolomon IslandsSomaliaSouth AfricaSouth AsiaSouth Asia (IDA & IBRD)SpainSri LankaSt. Kitts and NevisSt. LuciaSt. Vincent and the GrenadinesSub-Saharan Africa Sub-Saharan Africa (excluding high income)Sub-Saharan Africa (IDA & IBRD countries)SudanSurinameSwazilandSwedenSwitzerlandSyrian Arab RepublicTajikistanTanzaniaThailandTimor-LesteTogoTongaTrinidad and TobagoTunisiaTurkeyTurkmenistanTuvaluUgandaUkraineUnited Arab EmiratesUnited KingdomUnited StatesUpper middle incomeUruguayUzbekistanVanuatuVenezuela, RBVietnamWest Bank and GazaWorldZambiaZimbabwe Timeline:
This timeline shows a graph from 1966 to 2016 of Kenya. No data until 1965. Number of actual observations by date: 51.
Source name:
World Development Indicators
Source organization:
World Bank national accounts data, and OECD National Accounts data files.
Categories, topics:
Economy & Growth
Last updated:
apr 23, 2017
Indicators value changes by year
Minimum:
-10.073
jan 1, 1966
Maximum:
23.029
jan 1, 1967
At the date of observation
Value
Absolute change
Change from previous value
jan 1, 1966
-10.073
-10.073
0.0%
jan 1, 1967
23.029
+33.102
-328.61%
jan 1, 1968
1.736
-21.293
-92.46%
jan 1, 1969
4.863
+3.127
180.14%
jan 1, 1970
8.834
+3.971
81.66%
jan 1, 1971
-7.874
-16.708
-189.13%
jan 1, 1972
16.127
+24.001
-304.82%
jan 1, 1973
11.42
-4.707
-29.19%
jan 1, 1974
2.723
-8.697
-76.15%
jan 1, 1975
-2.441
-5.165
-189.64%
jan 1, 1976
7.362
+9.804
-401.57%
jan 1, 1977
1.906
-5.456
-74.11%
jan 1, 1978
9.995
+8.088
424.32%
jan 1, 1979
3.779
-6.215
-62.19%
jan 1, 1980
2.706
-1.073
-28.39%
jan 1, 1981
1.073
-1.633
-60.34%
jan 1, 1982
5.925
+4.852
451.97%
jan 1, 1983
7.367
+1.442
24.33%
jan 1, 1984
1.854
-5.513
-74.83%
jan 1, 1985
-3.475
-5.329
-287.46%
jan 1, 1986
4.013
+7.489
-215.48%
jan 1, 1987
4.925
+0.911
22.7%
jan 1, 1988
4.19
-0.734
-14.91%
jan 1, 1989
4.554
+0.363
8.67%
jan 1, 1990
4.113
-0.441
-9.67%
jan 1, 1991
3.472
-0.642
-15.6%
jan 1, 1992
-0.71
-4.182
-120.46%
jan 1, 1993
-3.326
-2.615
368.16%
jan 1, 1994
-3.272
+0.054
-1.62%
jan 1, 1995
3.077
+6.349
-194.05%
jan 1, 1996
4.792
+1.715
55.73%
jan 1, 1997
4.471
-0.321
-6.7%
jan 1, 1998
-3.065
-7.536
-168.55%
jan 1, 1999
8.29
+11.355
-370.44%
jan 1, 2000
7.092
-1.197
-14.44%
jan 1, 2001
-1.277
-8.37
-118.01%
jan 1, 2002
11.658
+12.935
-1.01K%
jan 1, 2003
-3.496
-15.154
-129.99%
jan 1, 2004
2.43
+5.927
-169.51%
jan 1, 2005
1.748
-0.682
-28.07%
jan 1, 2006
6.906
+5.158
295.05%
jan 1, 2007
1.73
-5.176
-74.95%
jan 1, 2008
5.09
+3.36
194.2%
jan 1, 2009
-4.983
-10.073
-197.9%
jan 1, 2010
-2.298
+2.685
-53.89%
jan 1, 2011
10.06
+12.358
-537.83%
jan 1, 2012
2.353
-7.707
-76.61%
jan 1, 2013
2.946
+0.593
25.2%
jan 1, 2014
5.445
+2.499
84.83%
jan 1, 2015
3.487
-1.959
-35.97%
jan 1, 2016
5.625
+2.138
61.32%
Ranking of countries by current statistics by years


Comments: