29
/
en
AIzaSyAYiBZKx7MnpbEhh9jyipgxe19OcubqV5w
April 1, 2024
155577
Indonesia
IDN
true
2
1
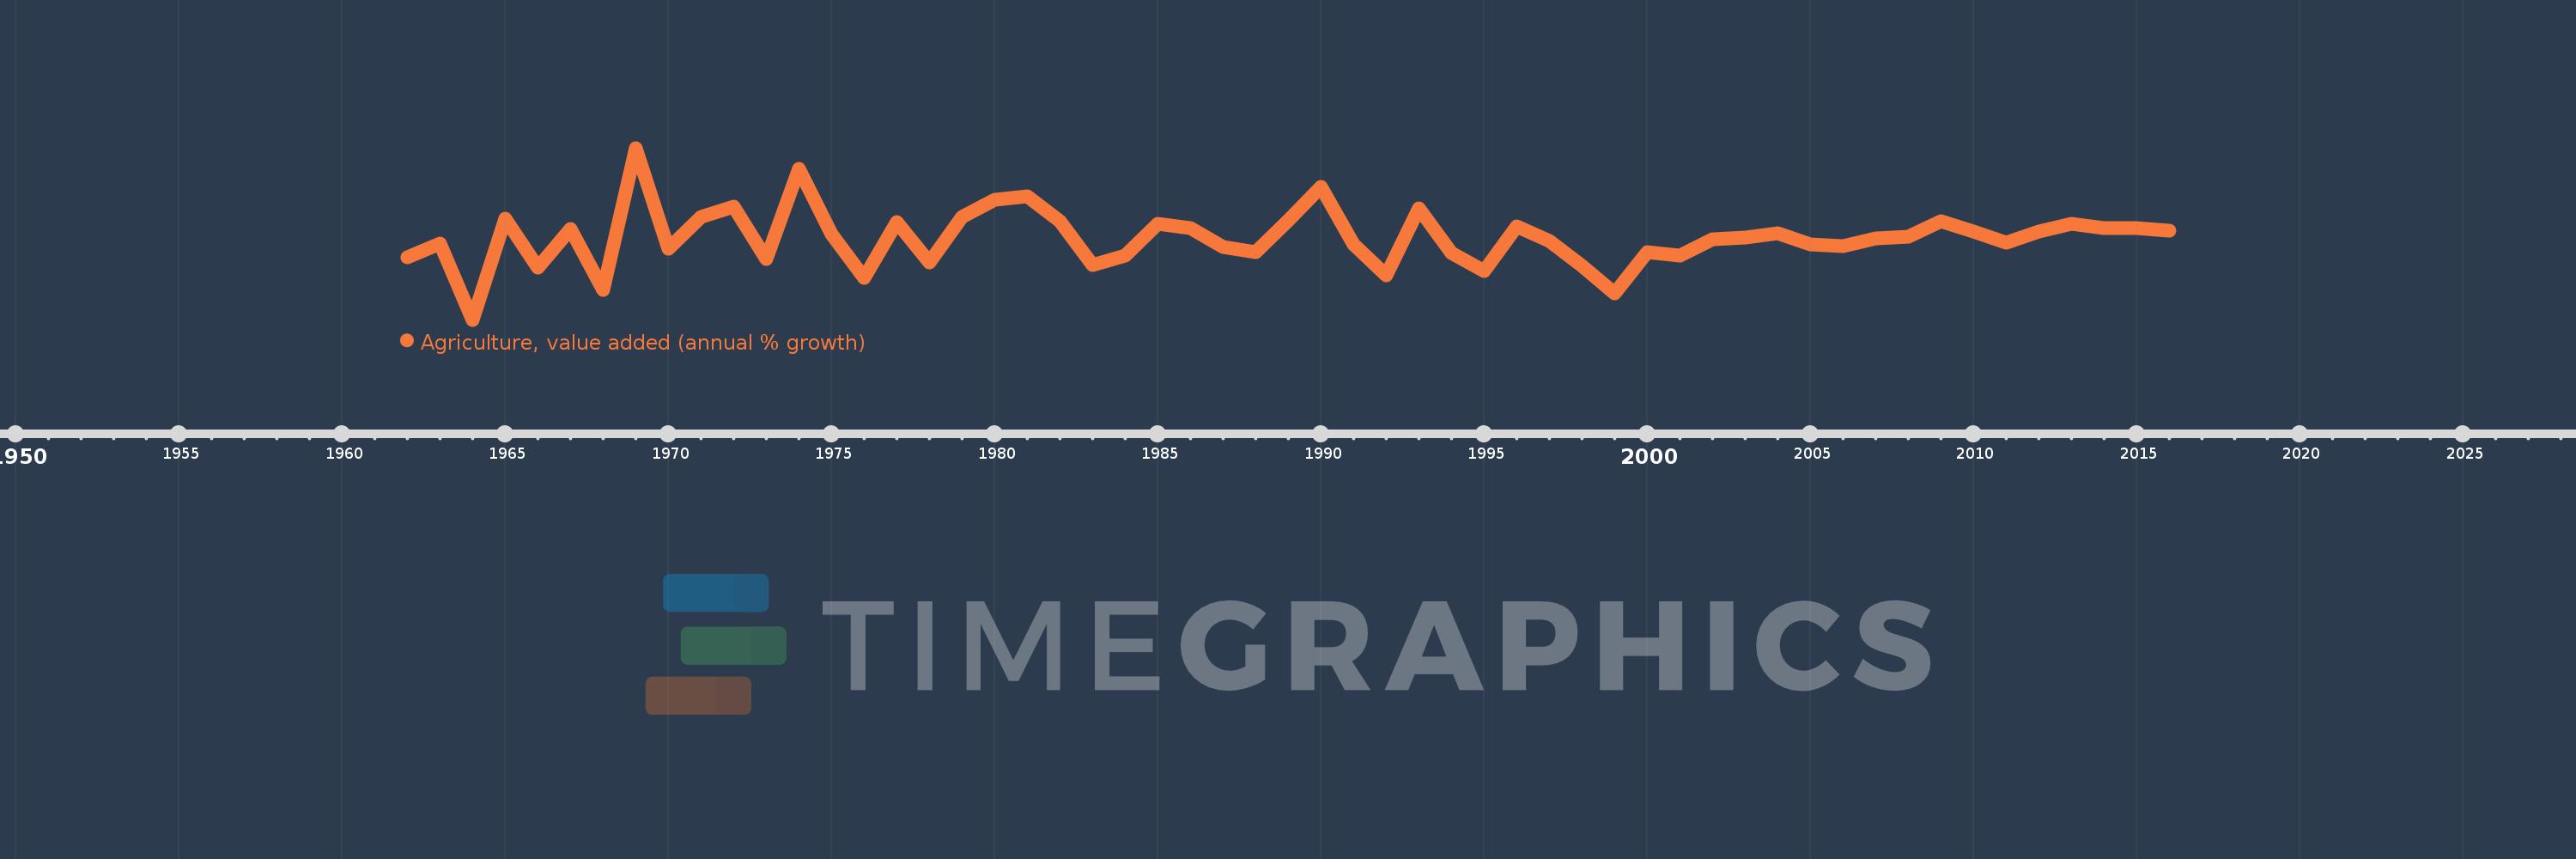
Agriculture, value added (annual % growth)
2016,2015,2014,2013,2012,2011,2010,2009,2008,2007,2006,2005,2004,2003,2002,2001,2000,1999,1998,1997,1996,1995,1994,1993,1992,1991,1990,1989,1988,1987,1986,1985,1984,1983,1982,1981,1980,1979,1978,1977,1976,1975,1974,1973,1972,1971,1970,1969,1968,1967,1966,1965,1964,1963,1962
This statistics in other country:
AfghanistanAlbaniaAlgeriaAntigua and BarbudaArab WorldArgentinaArmeniaAustraliaAustriaAzerbaijanBahamas, TheBahrainBangladeshBelarusBelgiumBelizeBeninBermudaBhutanBoliviaBosnia and HerzegovinaBotswanaBrazilBrunei DarussalamBulgariaBurkina FasoBurundiCabo VerdeCambodiaCameroonCanadaCaribbean small statesCayman IslandsCentral African RepublicCentral Europe and the BalticsChadChileChinaColombiaComorosCongo, Dem. Rep.Congo, Rep.Costa RicaCote d'IvoireCroatiaCubaCyprusCzech RepublicDenmarkDjiboutiDominicaDominican RepublicEarly-demographic dividendEast Asia & PacificEast Asia & Pacific (excluding high income)East Asia & Pacific (IDA & IBRD countries)EcuadorEgypt, Arab Rep.El SalvadorEquatorial GuineaEritreaEstoniaEthiopiaEuro areaEurope & Central AsiaEurope & Central Asia (excluding high income)Europe & Central Asia (IDA & IBRD countries)European UnionFijiFinlandFragile and conflict affected situationsFranceGabonGambia, TheGeorgiaGermanyGhanaGreeceGrenadaGuatemalaGuineaGuinea-BissauGuyanaHaitiHeavily indebted poor countries (HIPC)High incomeHondurasHong Kong SAR, ChinaHungaryIBRD onlyIcelandIDA & IBRD totalIDA blendIDA onlyIDA totalIndiaIndonesiaIran, Islamic Rep.IraqIrelandItalyJamaicaJapanJordanKazakhstanKenyaKiribatiKorea, Rep.KosovoKuwaitKyrgyz RepublicLao PDRLate-demographic dividendLatin America & Caribbean Latin America & Caribbean (excluding high income)Latin America & the Caribbean (IDA & IBRD countries)LatviaLeast developed countries: UN classificationLebanonLesothoLiberiaLithuaniaLow & middle incomeLow incomeLower middle incomeLuxembourgMacedonia, FYRMadagascarMalawiMalaysiaMaldivesMaliMarshall IslandsMauritaniaMauritiusMexicoMicronesia, Fed. Sts.Middle East & North AfricaMiddle East & North Africa (excluding high income)Middle East & North Africa (IDA & IBRD countries)Middle incomeMoldovaMongoliaMontenegroMoroccoMozambiqueMyanmarNamibiaNepalNetherlandsNew ZealandNicaraguaNigerNigeriaNorth AmericaNorwayOECD membersOmanOther small statesPakistanPalauPanamaPapua New GuineaParaguayPeruPhilippinesPolandPortugalPost-demographic dividendPre-demographic dividendPuerto RicoQatarRomaniaRussian FederationRwandaSamoaSao Tome and PrincipeSaudi ArabiaSenegalSerbiaSeychellesSierra LeoneSingaporeSlovak RepublicSloveniaSmall statesSolomon IslandsSomaliaSouth AfricaSouth AsiaSouth Asia (IDA & IBRD)SpainSri LankaSt. Kitts and NevisSt. LuciaSt. Vincent and the GrenadinesSub-Saharan Africa Sub-Saharan Africa (excluding high income)Sub-Saharan Africa (IDA & IBRD countries)SudanSurinameSwazilandSwedenSwitzerlandSyrian Arab RepublicTajikistanTanzaniaThailandTimor-LesteTogoTongaTrinidad and TobagoTunisiaTurkeyTurkmenistanTuvaluUgandaUkraineUnited Arab EmiratesUnited KingdomUnited StatesUpper middle incomeUruguayUzbekistanVanuatuVenezuela, RBVietnamWest Bank and GazaWorldZambiaZimbabwe Timeline:
This timeline shows a graph from 1962 to 2016 of Indonesia. No data until 1961. Number of actual observations by date: 55.
Source name:
World Development Indicators
Source organization:
World Bank national accounts data, and OECD National Accounts data files.
Categories, topics:
Economy & Growth
Last updated:
apr 23, 2017
Indicators value changes by year
Minimum:
-3.615
jan 1, 1964
Maximum:
11.088
jan 1, 1969
At the date of observation
Value
Absolute change
Change from previous value
jan 1, 1962
1.719
+1.719
0.0%
jan 1, 1963
2.873
+1.154
67.11%
jan 1, 1964
-3.615
-6.488
-225.8%
jan 1, 1965
5.057
+8.671
-239.9%
jan 1, 1966
0.811
-4.246
-83.96%
jan 1, 1967
4.131
+3.32
409.29%
jan 1, 1968
-1.031
-5.162
-124.95%
jan 1, 1969
11.088
+12.119
-1.18K%
jan 1, 1970
2.483
-8.605
-77.61%
jan 1, 1971
5.213
+2.73
109.94%
jan 1, 1972
6.084
+0.871
16.71%
jan 1, 1973
1.557
-4.528
-74.42%
jan 1, 1974
9.319
+7.762
498.67%
jan 1, 1975
3.727
-5.592
-60.01%
jan 1, 1976
0.0
-3.727
-100.0%
jan 1, 1977
4.731
+4.731
%
jan 1, 1978
1.257
-3.474
-73.42%
jan 1, 1979
5.166
+3.908
310.85%
jan 1, 1980
6.654
+1.488
28.8%
jan 1, 1981
6.918
+0.264
3.97%
jan 1, 1982
4.804
-2.114
-30.56%
jan 1, 1983
1.07
-3.734
-77.73%
jan 1, 1984
1.871
+0.801
74.9%
jan 1, 1985
4.617
+2.745
146.7%
jan 1, 1986
4.251
-0.366
-7.92%
jan 1, 1987
2.586
-1.665
-39.17%
jan 1, 1988
2.144
-0.442
-17.1%
jan 1, 1989
4.898
+2.754
128.47%
jan 1, 1990
7.79
+2.893
59.06%
jan 1, 1991
2.836
-4.955
-63.6%
jan 1, 1992
0.192
-2.643
-93.21%
jan 1, 1993
5.936
+5.744
2.98K%
jan 1, 1994
2.126
-3.811
-64.19%
jan 1, 1995
0.556
-1.57
-73.84%
jan 1, 1996
4.375
+3.819
686.97%
jan 1, 1997
3.139
-1.236
-28.25%
jan 1, 1998
1.003
-2.136
-68.06%
jan 1, 1999
-1.332
-2.334
-232.79%
jan 1, 2000
2.163
+3.494
-262.44%
jan 1, 2001
1.883
-0.28
-12.95%
jan 1, 2002
3.256
+1.373
72.93%
jan 1, 2003
3.449
+0.193
5.93%
jan 1, 2004
3.788
+0.339
9.83%
jan 1, 2005
2.819
-0.969
-25.59%
jan 1, 2006
2.718
-0.101
-3.58%
jan 1, 2007
3.356
+0.638
23.48%
jan 1, 2008
3.47
+0.114
3.4%
jan 1, 2009
4.828
+1.358
39.13%
jan 1, 2010
3.958
-0.871
-18.03%
jan 1, 2011
3.006
-0.952
-24.06%
jan 1, 2012
3.947
+0.941
31.32%
jan 1, 2013
4.587
+0.64
16.2%
jan 1, 2014
4.204
-0.382
-8.33%
jan 1, 2015
4.239
+0.034
0.82%
jan 1, 2016
4.021
-0.217
-5.13%
Ranking of countries by current statistics by years


Comments: