29
/
en
AIzaSyAYiBZKx7MnpbEhh9jyipgxe19OcubqV5w
April 1, 2024
149962
Honduras
HND
true
2
1
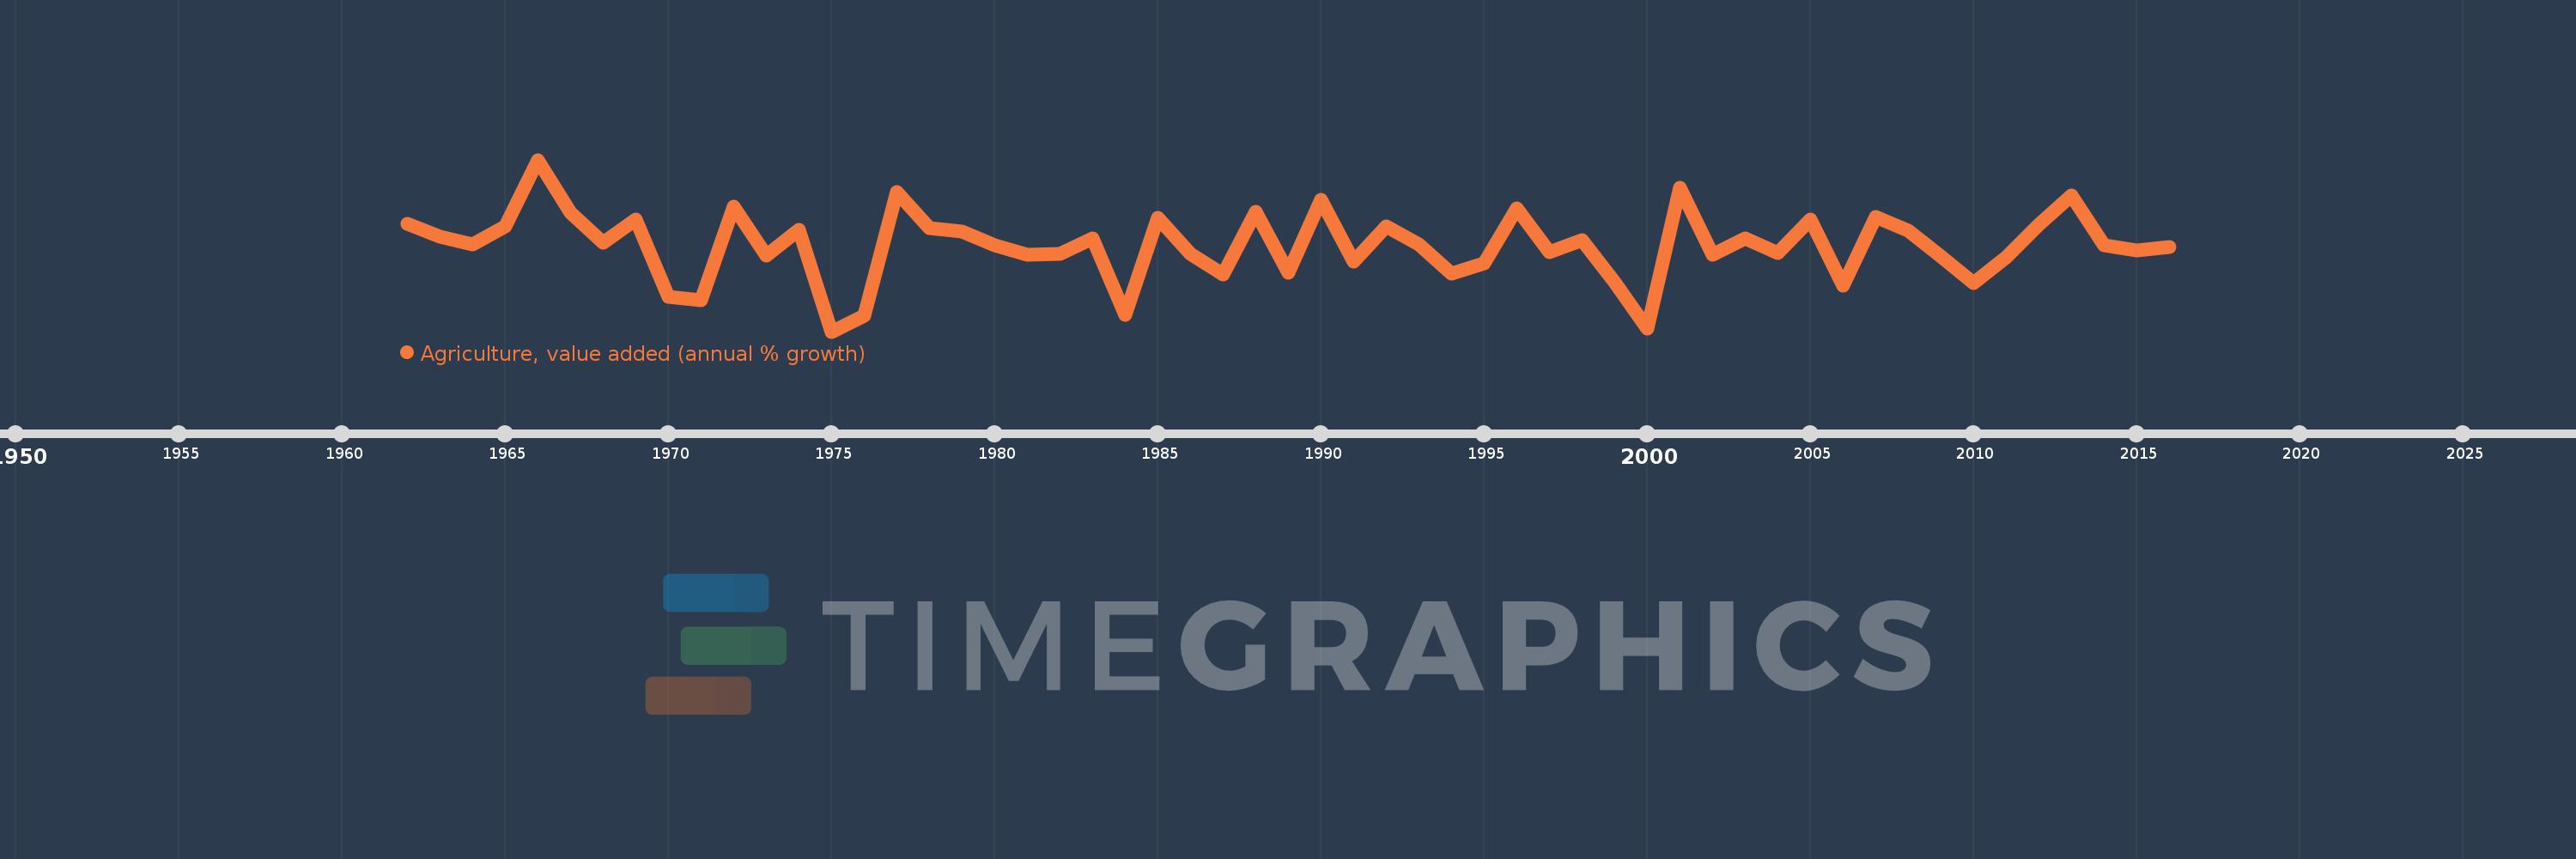
Agriculture, value added (annual % growth)
2016,2015,2014,2013,2012,2011,2010,2009,2008,2007,2006,2005,2004,2003,2002,2001,2000,1999,1998,1997,1996,1995,1994,1993,1992,1991,1990,1989,1988,1987,1986,1985,1984,1983,1982,1981,1980,1979,1978,1977,1976,1975,1974,1973,1972,1971,1970,1969,1968,1967,1966,1965,1964,1963,1962
This statistics in other country:
AfghanistanAlbaniaAlgeriaAntigua and BarbudaArab WorldArgentinaArmeniaAustraliaAustriaAzerbaijanBahamas, TheBahrainBangladeshBelarusBelgiumBelizeBeninBermudaBhutanBoliviaBosnia and HerzegovinaBotswanaBrazilBrunei DarussalamBulgariaBurkina FasoBurundiCabo VerdeCambodiaCameroonCanadaCaribbean small statesCayman IslandsCentral African RepublicCentral Europe and the BalticsChadChileChinaColombiaComorosCongo, Dem. Rep.Congo, Rep.Costa RicaCote d'IvoireCroatiaCubaCyprusCzech RepublicDenmarkDjiboutiDominicaDominican RepublicEarly-demographic dividendEast Asia & PacificEast Asia & Pacific (excluding high income)East Asia & Pacific (IDA & IBRD countries)EcuadorEgypt, Arab Rep.El SalvadorEquatorial GuineaEritreaEstoniaEthiopiaEuro areaEurope & Central AsiaEurope & Central Asia (excluding high income)Europe & Central Asia (IDA & IBRD countries)European UnionFijiFinlandFragile and conflict affected situationsFranceGabonGambia, TheGeorgiaGermanyGhanaGreeceGrenadaGuatemalaGuineaGuinea-BissauGuyanaHaitiHeavily indebted poor countries (HIPC)High incomeHondurasHong Kong SAR, ChinaHungaryIBRD onlyIcelandIDA & IBRD totalIDA blendIDA onlyIDA totalIndiaIndonesiaIran, Islamic Rep.IraqIrelandItalyJamaicaJapanJordanKazakhstanKenyaKiribatiKorea, Rep.KosovoKuwaitKyrgyz RepublicLao PDRLate-demographic dividendLatin America & Caribbean Latin America & Caribbean (excluding high income)Latin America & the Caribbean (IDA & IBRD countries)LatviaLeast developed countries: UN classificationLebanonLesothoLiberiaLithuaniaLow & middle incomeLow incomeLower middle incomeLuxembourgMacedonia, FYRMadagascarMalawiMalaysiaMaldivesMaliMarshall IslandsMauritaniaMauritiusMexicoMicronesia, Fed. Sts.Middle East & North AfricaMiddle East & North Africa (excluding high income)Middle East & North Africa (IDA & IBRD countries)Middle incomeMoldovaMongoliaMontenegroMoroccoMozambiqueMyanmarNamibiaNepalNetherlandsNew ZealandNicaraguaNigerNigeriaNorth AmericaNorwayOECD membersOmanOther small statesPakistanPalauPanamaPapua New GuineaParaguayPeruPhilippinesPolandPortugalPost-demographic dividendPre-demographic dividendPuerto RicoQatarRomaniaRussian FederationRwandaSamoaSao Tome and PrincipeSaudi ArabiaSenegalSerbiaSeychellesSierra LeoneSingaporeSlovak RepublicSloveniaSmall statesSolomon IslandsSomaliaSouth AfricaSouth AsiaSouth Asia (IDA & IBRD)SpainSri LankaSt. Kitts and NevisSt. LuciaSt. Vincent and the GrenadinesSub-Saharan Africa Sub-Saharan Africa (excluding high income)Sub-Saharan Africa (IDA & IBRD countries)SudanSurinameSwazilandSwedenSwitzerlandSyrian Arab RepublicTajikistanTanzaniaThailandTimor-LesteTogoTongaTrinidad and TobagoTunisiaTurkeyTurkmenistanTuvaluUgandaUkraineUnited Arab EmiratesUnited KingdomUnited StatesUpper middle incomeUruguayUzbekistanVanuatuVenezuela, RBVietnamWest Bank and GazaWorldZambiaZimbabwe Timeline:
This timeline shows a graph from 1962 to 2016 of Honduras. No data until 1961. Number of actual observations by date: 55.
Source name:
World Development Indicators
Source organization:
World Bank national accounts data, and OECD National Accounts data files.
Categories, topics:
Economy & Growth
Last updated:
apr 23, 2017
Indicators value changes by year
Minimum:
-8.937
jan 1, 1975
At the date of observation
Value
Absolute change
Change from previous value
jan 1, 1962
6.527
+6.527
0.0%
jan 1, 1963
4.753
-1.775
-27.19%
jan 1, 1964
3.637
-1.115
-23.47%
jan 1, 1965
6.223
+2.586
71.1%
jan 1, 1966
15.77
+9.547
153.42%
jan 1, 1967
8.12
-7.65
-48.51%
jan 1, 1968
3.891
-4.229
-52.08%
jan 1, 1969
7.216
+3.325
85.44%
jan 1, 1970
-3.909
-11.124
-154.17%
jan 1, 1971
-4.411
-0.502
12.85%
jan 1, 1972
9.043
+13.453
-305.01%
jan 1, 1973
1.951
-7.091
-78.42%
jan 1, 1974
5.742
+3.79
194.26%
jan 1, 1975
-8.937
-14.678
-255.65%
jan 1, 1976
-6.708
+2.229
-24.94%
jan 1, 1977
11.185
+17.893
-266.74%
jan 1, 1978
5.988
-5.197
-46.46%
jan 1, 1979
5.424
-0.564
-9.42%
jan 1, 1980
3.43
-1.994
-36.76%
jan 1, 1981
2.073
-1.357
-39.57%
jan 1, 1982
2.234
+0.161
7.77%
jan 1, 1983
4.469
+2.235
100.08%
jan 1, 1984
-6.559
-11.028
-246.77%
jan 1, 1985
7.426
+13.985
-213.22%
jan 1, 1986
2.273
-5.154
-69.4%
jan 1, 1987
-0.741
-3.013
-132.59%
jan 1, 1988
8.302
+9.043
-1.22K%
jan 1, 1989
-0.517
-8.819
-106.22%
jan 1, 1990
10.043
+10.56
-2.04K%
jan 1, 1991
1.101
-8.942
-89.03%
jan 1, 1992
6.148
+5.046
458.14%
jan 1, 1993
3.592
-2.555
-41.57%
jan 1, 1994
-0.637
-4.229
-117.73%
jan 1, 1995
0.855
+1.492
-234.19%
jan 1, 1996
8.757
+7.902
924.58%
jan 1, 1997
2.468
-6.29
-71.82%
jan 1, 1998
4.246
+1.778
72.07%
jan 1, 1999
-1.884
-6.13
-144.38%
jan 1, 2000
-8.488
-6.604
350.42%
jan 1, 2001
11.713
+20.201
-237.99%
jan 1, 2002
2.121
-9.592
-81.89%
jan 1, 2003
4.503
+2.382
112.32%
jan 1, 2004
2.349
-2.154
-47.83%
jan 1, 2005
7.221
+4.872
207.4%
jan 1, 2006
-2.294
-9.515
-131.76%
jan 1, 2007
7.578
+9.872
-430.36%
jan 1, 2008
5.542
-2.036
-26.87%
jan 1, 2009
1.927
-3.615
-65.23%
jan 1, 2010
-1.948
-3.875
-201.1%
jan 1, 2011
1.774
+3.721
-191.05%
jan 1, 2012
6.484
+4.711
265.61%
jan 1, 2013
10.683
+4.199
64.75%
jan 1, 2014
3.44
-7.243
-67.8%
jan 1, 2015
2.719
-0.721
-20.95%
jan 1, 2016
3.239
+0.52
19.11%
Ranking of countries by current statistics by years


Comments: