29
/
en
AIzaSyAYiBZKx7MnpbEhh9jyipgxe19OcubqV5w
April 1, 2024
226588
Puerto Rico
PRI
true
2
1
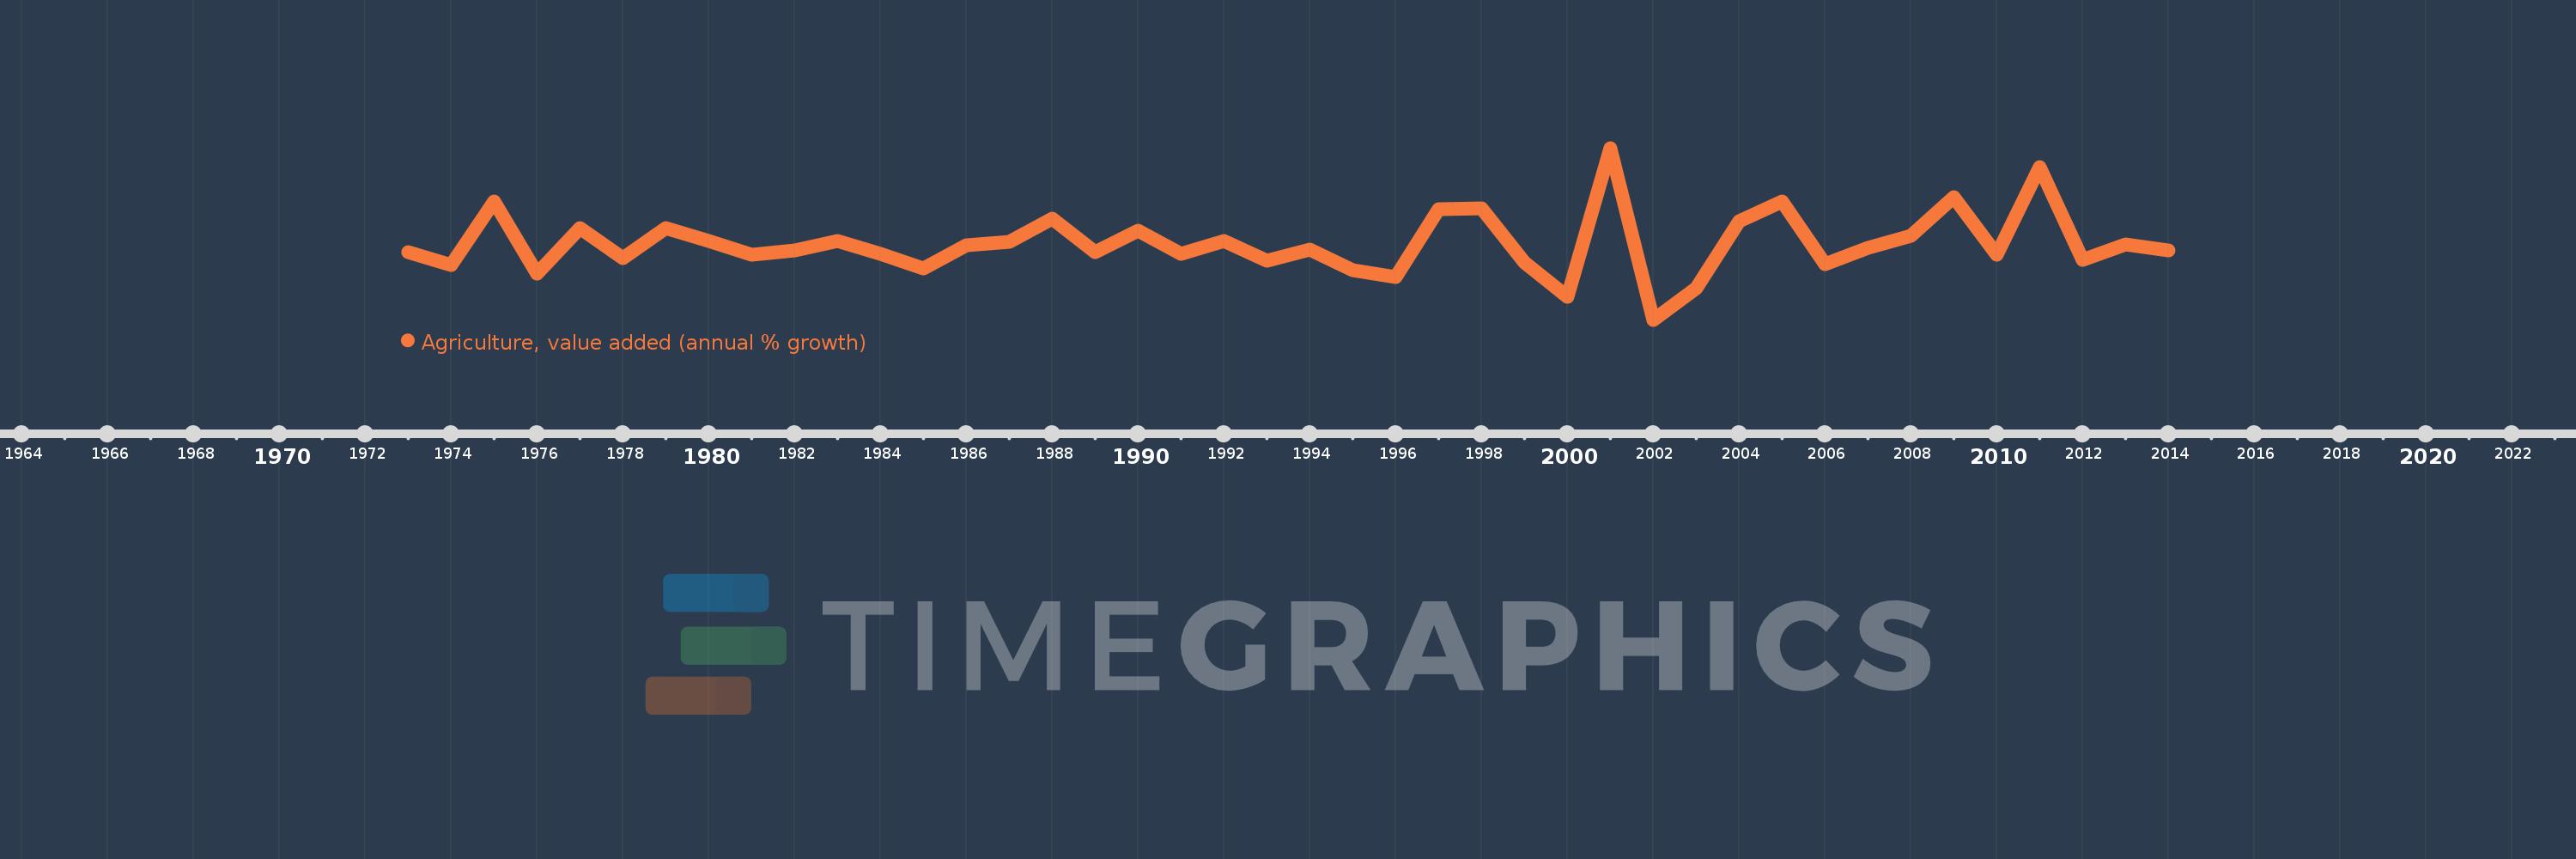
Agriculture, value added (annual % growth)
2014,2013,2012,2011,2010,2009,2008,2007,2006,2005,2004,2003,2002,2001,2000,1999,1998,1997,1996,1995,1994,1993,1992,1991,1990,1989,1988,1987,1986,1985,1984,1983,1982,1981,1980,1979,1978,1977,1976,1975,1974,1973
This statistics in other country:
AfghanistanAlbaniaAlgeriaAntigua and BarbudaArab WorldArgentinaArmeniaAustraliaAustriaAzerbaijanBahamas, TheBahrainBangladeshBelarusBelgiumBelizeBeninBermudaBhutanBoliviaBosnia and HerzegovinaBotswanaBrazilBrunei DarussalamBulgariaBurkina FasoBurundiCabo VerdeCambodiaCameroonCanadaCaribbean small statesCayman IslandsCentral African RepublicCentral Europe and the BalticsChadChileChinaColombiaComorosCongo, Dem. Rep.Congo, Rep.Costa RicaCote d'IvoireCroatiaCubaCyprusCzech RepublicDenmarkDjiboutiDominicaDominican RepublicEarly-demographic dividendEast Asia & PacificEast Asia & Pacific (excluding high income)East Asia & Pacific (IDA & IBRD countries)EcuadorEgypt, Arab Rep.El SalvadorEquatorial GuineaEritreaEstoniaEthiopiaEuro areaEurope & Central AsiaEurope & Central Asia (excluding high income)Europe & Central Asia (IDA & IBRD countries)European UnionFijiFinlandFragile and conflict affected situationsFranceGabonGambia, TheGeorgiaGermanyGhanaGreeceGrenadaGuatemalaGuineaGuinea-BissauGuyanaHaitiHeavily indebted poor countries (HIPC)High incomeHondurasHong Kong SAR, ChinaHungaryIBRD onlyIcelandIDA & IBRD totalIDA blendIDA onlyIDA totalIndiaIndonesiaIran, Islamic Rep.IraqIrelandItalyJamaicaJapanJordanKazakhstanKenyaKiribatiKorea, Rep.KosovoKuwaitKyrgyz RepublicLao PDRLate-demographic dividendLatin America & Caribbean Latin America & Caribbean (excluding high income)Latin America & the Caribbean (IDA & IBRD countries)LatviaLeast developed countries: UN classificationLebanonLesothoLiberiaLithuaniaLow & middle incomeLow incomeLower middle incomeLuxembourgMacedonia, FYRMadagascarMalawiMalaysiaMaldivesMaliMarshall IslandsMauritaniaMauritiusMexicoMicronesia, Fed. Sts.Middle East & North AfricaMiddle East & North Africa (excluding high income)Middle East & North Africa (IDA & IBRD countries)Middle incomeMoldovaMongoliaMontenegroMoroccoMozambiqueMyanmarNamibiaNepalNetherlandsNew ZealandNicaraguaNigerNigeriaNorth AmericaNorwayOECD membersOmanOther small statesPakistanPalauPanamaPapua New GuineaParaguayPeruPhilippinesPolandPortugalPost-demographic dividendPre-demographic dividendPuerto RicoQatarRomaniaRussian FederationRwandaSamoaSao Tome and PrincipeSaudi ArabiaSenegalSerbiaSeychellesSierra LeoneSingaporeSlovak RepublicSloveniaSmall statesSolomon IslandsSomaliaSouth AfricaSouth AsiaSouth Asia (IDA & IBRD)SpainSri LankaSt. Kitts and NevisSt. LuciaSt. Vincent and the GrenadinesSub-Saharan Africa Sub-Saharan Africa (excluding high income)Sub-Saharan Africa (IDA & IBRD countries)SudanSurinameSwazilandSwedenSwitzerlandSyrian Arab RepublicTajikistanTanzaniaThailandTimor-LesteTogoTongaTrinidad and TobagoTunisiaTurkeyTurkmenistanTuvaluUgandaUkraineUnited Arab EmiratesUnited KingdomUnited StatesUpper middle incomeUruguayUzbekistanVanuatuVenezuela, RBVietnamWest Bank and GazaWorldZambiaZimbabwe Timeline:
This timeline shows a graph from 1973 to 2014 of Puerto Rico. No data until 1972. Number of actual observations by date: 42.
Source name:
World Development Indicators
Source organization:
World Bank national accounts data, and OECD National Accounts data files.
Categories, topics:
Economy & Growth
Last updated:
apr 23, 2017
Indicators value changes by year
Minimum:
-35.652
jan 1, 2002
Maximum:
51.316
jan 1, 2001
At the date of observation
Value
Absolute change
Change from previous value
jan 1, 1973
-1.408
-1.408
0.0%
jan 1, 1974
-7.857
-6.449
457.86%
jan 1, 1975
24.031
+31.888
-405.85%
jan 1, 1976
-12.5
-36.531
-152.02%
jan 1, 1977
10.714
+23.214
-185.71%
jan 1, 1978
-4.516
-15.23
-142.15%
jan 1, 1979
10.811
+15.327
-339.38%
jan 1, 1980
4.268
-6.543
-60.52%
jan 1, 1981
-2.924
-7.192
-168.5%
jan 1, 1982
-0.602
+2.322
-79.4%
jan 1, 1983
4.242
+4.845
-804.24%
jan 1, 1984
-2.326
-6.568
-154.82%
jan 1, 1985
-9.524
-7.198
309.52%
jan 1, 1986
1.974
+11.497
-120.72%
jan 1, 1987
3.871
+1.897
96.13%
jan 1, 1988
15.528
+11.657
301.14%
jan 1, 1989
-1.613
-17.141
-110.39%
jan 1, 1990
9.29
+10.903
-675.96%
jan 1, 1991
-2.5
-11.79
-126.91%
jan 1, 1992
4.103
+6.603
-264.1%
jan 1, 1993
-5.911
-10.014
-244.09%
jan 1, 1994
0.0
+5.911
-100.0%
jan 1, 1995
-10.471
-10.471
%
jan 1, 1996
-14.035
-3.564
34.04%
jan 1, 1997
20.408
+34.443
-245.41%
jan 1, 1998
20.904
+0.496
2.43%
jan 1, 1999
-6.542
-27.446
-131.3%
jan 1, 2000
-24.0
-17.458
266.86%
jan 1, 2001
51.316
+75.316
-313.82%
jan 1, 2002
-35.652
-86.968
-169.48%
jan 1, 2003
-19.595
+16.058
-45.04%
jan 1, 2004
14.286
+33.88
-172.91%
jan 1, 2005
24.265
+9.979
69.85%
jan 1, 2006
-7.692
-31.957
-131.7%
jan 1, 2007
0.641
+8.333
-108.33%
jan 1, 2008
7.006
+6.365
992.99%
jan 1, 2009
26.547
+19.541
278.9%
jan 1, 2010
-2.734
-29.281
-110.3%
jan 1, 2011
41.421
+44.155
-1.61K%
jan 1, 2012
-5.211
-46.632
-112.58%
jan 1, 2013
2.463
+7.675
-147.27%
jan 1, 2014
-0.353
-2.816
-114.33%
Ranking of countries by current statistics by years


Comments: