29
/
en
AIzaSyAYiBZKx7MnpbEhh9jyipgxe19OcubqV5w
April 1, 2024
158191
Iraq
IRQ
true
2
1
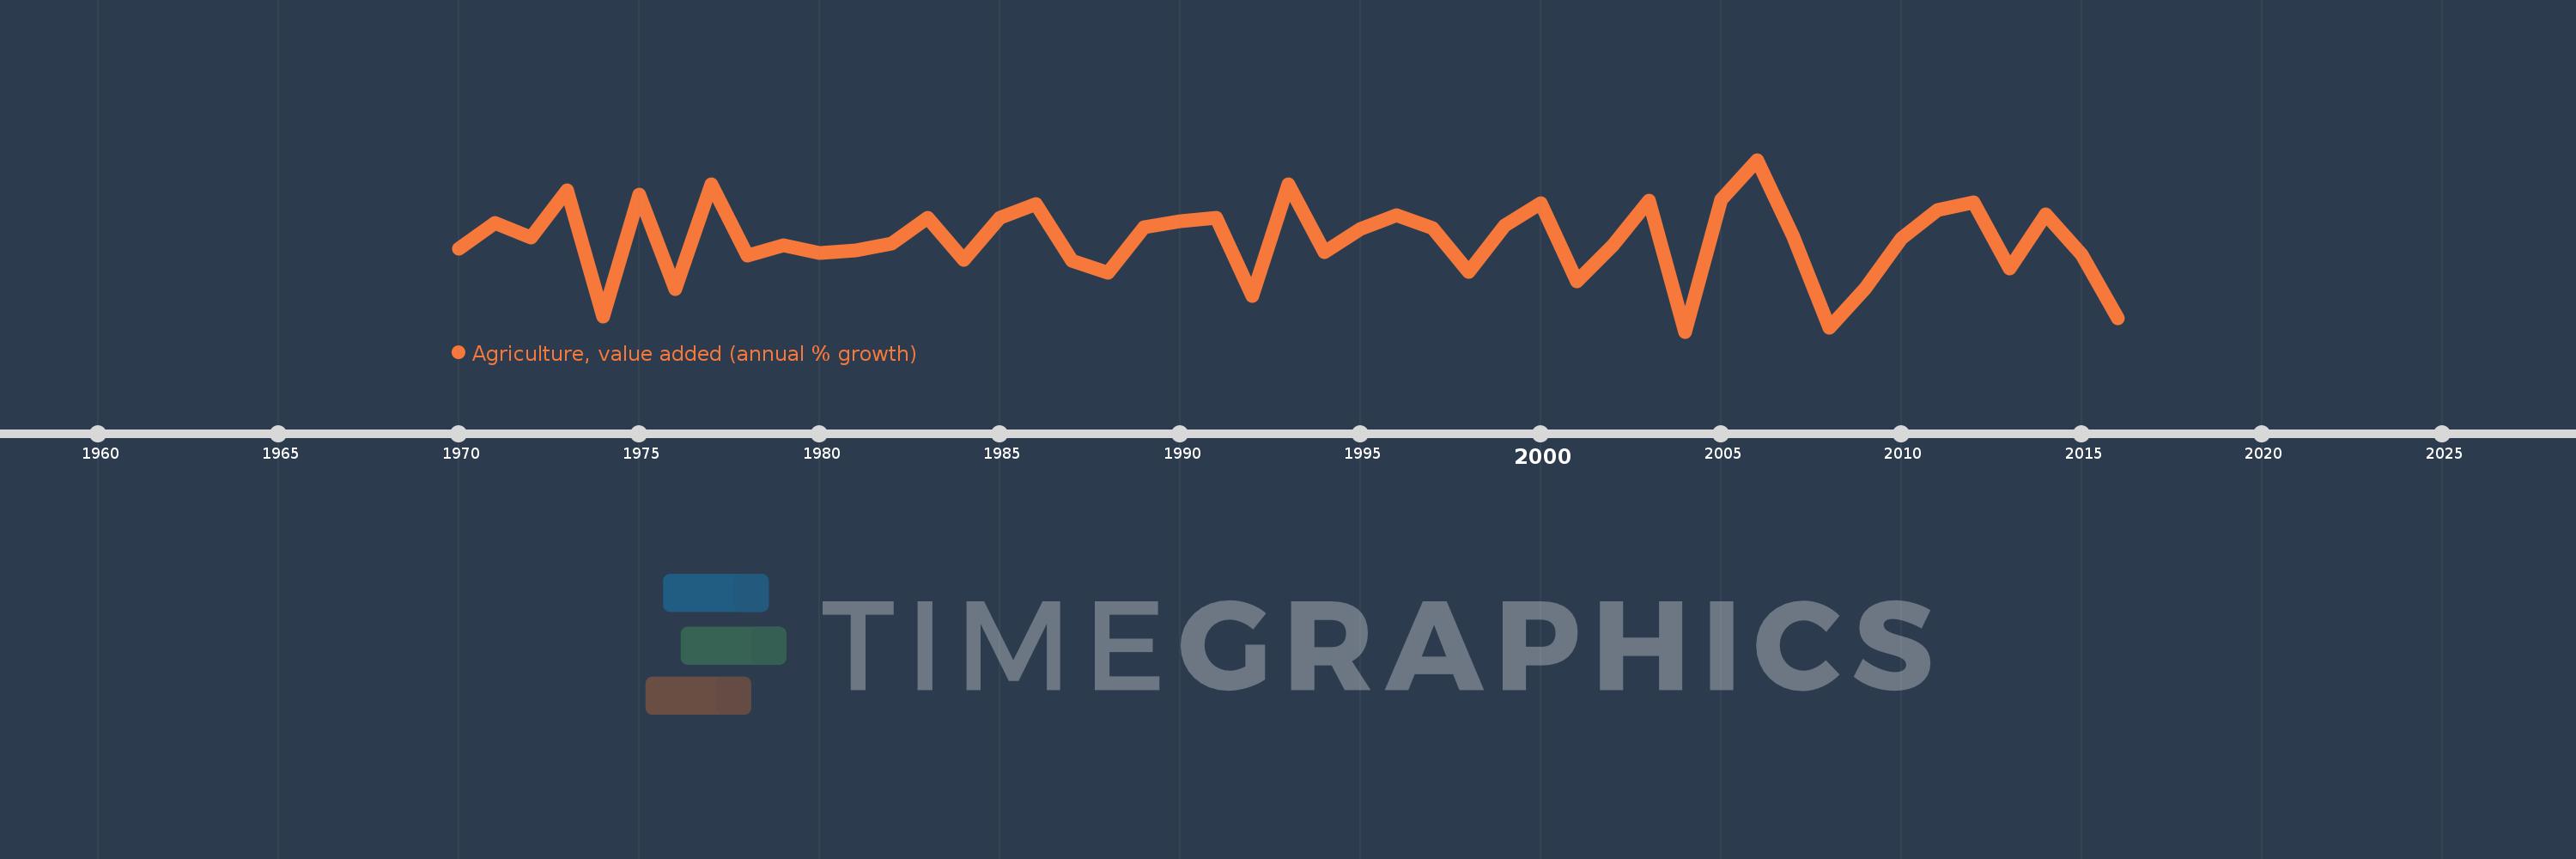
Agriculture, value added (annual % growth)
2016,2015,2014,2013,2012,2011,2010,2009,2008,2007,2006,2005,2004,2003,2002,2001,2000,1999,1998,1997,1996,1995,1994,1993,1992,1991,1990,1989,1988,1987,1986,1985,1984,1983,1982,1981,1980,1979,1978,1977,1976,1975,1974,1973,1972,1971,1970
This statistics in other country:
AfghanistanAlbaniaAlgeriaAntigua and BarbudaArab WorldArgentinaArmeniaAustraliaAustriaAzerbaijanBahamas, TheBahrainBangladeshBelarusBelgiumBelizeBeninBermudaBhutanBoliviaBosnia and HerzegovinaBotswanaBrazilBrunei DarussalamBulgariaBurkina FasoBurundiCabo VerdeCambodiaCameroonCanadaCaribbean small statesCayman IslandsCentral African RepublicCentral Europe and the BalticsChadChileChinaColombiaComorosCongo, Dem. Rep.Congo, Rep.Costa RicaCote d'IvoireCroatiaCubaCyprusCzech RepublicDenmarkDjiboutiDominicaDominican RepublicEarly-demographic dividendEast Asia & PacificEast Asia & Pacific (excluding high income)East Asia & Pacific (IDA & IBRD countries)EcuadorEgypt, Arab Rep.El SalvadorEquatorial GuineaEritreaEstoniaEthiopiaEuro areaEurope & Central AsiaEurope & Central Asia (excluding high income)Europe & Central Asia (IDA & IBRD countries)European UnionFijiFinlandFragile and conflict affected situationsFranceGabonGambia, TheGeorgiaGermanyGhanaGreeceGrenadaGuatemalaGuineaGuinea-BissauGuyanaHaitiHeavily indebted poor countries (HIPC)High incomeHondurasHong Kong SAR, ChinaHungaryIBRD onlyIcelandIDA & IBRD totalIDA blendIDA onlyIDA totalIndiaIndonesiaIran, Islamic Rep.IraqIrelandItalyJamaicaJapanJordanKazakhstanKenyaKiribatiKorea, Rep.KosovoKuwaitKyrgyz RepublicLao PDRLate-demographic dividendLatin America & Caribbean Latin America & Caribbean (excluding high income)Latin America & the Caribbean (IDA & IBRD countries)LatviaLeast developed countries: UN classificationLebanonLesothoLiberiaLithuaniaLow & middle incomeLow incomeLower middle incomeLuxembourgMacedonia, FYRMadagascarMalawiMalaysiaMaldivesMaliMarshall IslandsMauritaniaMauritiusMexicoMicronesia, Fed. Sts.Middle East & North AfricaMiddle East & North Africa (excluding high income)Middle East & North Africa (IDA & IBRD countries)Middle incomeMoldovaMongoliaMontenegroMoroccoMozambiqueMyanmarNamibiaNepalNetherlandsNew ZealandNicaraguaNigerNigeriaNorth AmericaNorwayOECD membersOmanOther small statesPakistanPalauPanamaPapua New GuineaParaguayPeruPhilippinesPolandPortugalPost-demographic dividendPre-demographic dividendPuerto RicoQatarRomaniaRussian FederationRwandaSamoaSao Tome and PrincipeSaudi ArabiaSenegalSerbiaSeychellesSierra LeoneSingaporeSlovak RepublicSloveniaSmall statesSolomon IslandsSomaliaSouth AfricaSouth AsiaSouth Asia (IDA & IBRD)SpainSri LankaSt. Kitts and NevisSt. LuciaSt. Vincent and the GrenadinesSub-Saharan Africa Sub-Saharan Africa (excluding high income)Sub-Saharan Africa (IDA & IBRD countries)SudanSurinameSwazilandSwedenSwitzerlandSyrian Arab RepublicTajikistanTanzaniaThailandTimor-LesteTogoTongaTrinidad and TobagoTunisiaTurkeyTurkmenistanTuvaluUgandaUkraineUnited Arab EmiratesUnited KingdomUnited StatesUpper middle incomeUruguayUzbekistanVanuatuVenezuela, RBVietnamWest Bank and GazaWorldZambiaZimbabwe Timeline:
This timeline shows a graph from 1970 to 2016 of Iraq. No data until 1969. Number of actual observations by date: 47.
Source name:
World Development Indicators
Source organization:
World Bank national accounts data, and OECD National Accounts data files.
Categories, topics:
Economy & Growth
Last updated:
apr 23, 2017
Indicators value changes by year
Minimum:
-29.126
jan 1, 2004
Maximum:
31.355
jan 1, 2006
At the date of observation
Value
Absolute change
Change from previous value
jan 1, 1970
0.171
+0.171
0.0%
jan 1, 1971
9.088
+8.917
5.22K%
jan 1, 1972
3.966
-5.122
-56.36%
jan 1, 1973
20.526
+16.56
417.57%
jan 1, 1974
-23.795
-44.322
-215.93%
jan 1, 1975
19.178
+42.974
-180.6%
jan 1, 1976
-14.106
-33.284
-173.55%
jan 1, 1977
22.698
+36.804
-260.92%
jan 1, 1978
-2.51
-25.209
-111.06%
jan 1, 1979
1.209
+3.719
-148.16%
jan 1, 1980
-1.432
-2.641
-218.42%
jan 1, 1981
-0.527
+0.904
-63.17%
jan 1, 1982
1.911
+2.439
-462.44%
jan 1, 1983
10.869
+8.958
468.69%
jan 1, 1984
-3.836
-14.705
-135.29%
jan 1, 1985
10.965
+14.801
-385.86%
jan 1, 1986
15.725
+4.76
43.41%
jan 1, 1987
-4.296
-20.021
-127.32%
jan 1, 1988
-8.344
-4.048
94.22%
jan 1, 1989
7.69
+16.034
-192.16%
jan 1, 1990
9.724
+2.033
26.44%
jan 1, 1991
10.865
+1.142
11.74%
jan 1, 1992
-16.55
-27.415
-252.32%
jan 1, 1993
22.755
+39.304
-237.49%
jan 1, 1994
-1.118
-23.873
-104.91%
jan 1, 1995
7.118
+8.237
-736.49%
jan 1, 1996
11.954
+4.836
67.93%
jan 1, 1997
7.404
-4.55
-38.06%
jan 1, 1998
-8.103
-15.507
-209.44%
jan 1, 1999
8.256
+16.359
-201.89%
jan 1, 2000
15.937
+7.681
93.03%
jan 1, 2001
-11.551
-27.488
-172.48%
jan 1, 2002
1.199
+12.75
-110.38%
jan 1, 2003
16.981
+15.783
1.32K%
jan 1, 2004
-29.126
-46.107
-271.52%
jan 1, 2005
17.44
+46.566
-159.88%
jan 1, 2006
31.355
+13.915
79.78%
jan 1, 2007
4.315
-27.04
-86.24%
jan 1, 2008
-27.699
-32.014
-741.91%
jan 1, 2009
-13.902
+13.797
-49.81%
jan 1, 2010
3.56
+17.462
-125.6%
jan 1, 2011
13.515
+9.955
279.67%
jan 1, 2012
16.271
+2.757
20.4%
jan 1, 2013
-6.899
-23.171
-142.4%
jan 1, 2014
12.189
+19.088
-276.66%
jan 1, 2015
-2.0
-14.189
-116.41%
jan 1, 2016
-24.5
-22.5
1.13K%
Ranking of countries by current statistics by years


Comments: