29
/
en
AIzaSyAYiBZKx7MnpbEhh9jyipgxe19OcubqV5w
April 1, 2024
184813
Madagascar
MDG
true
2
1
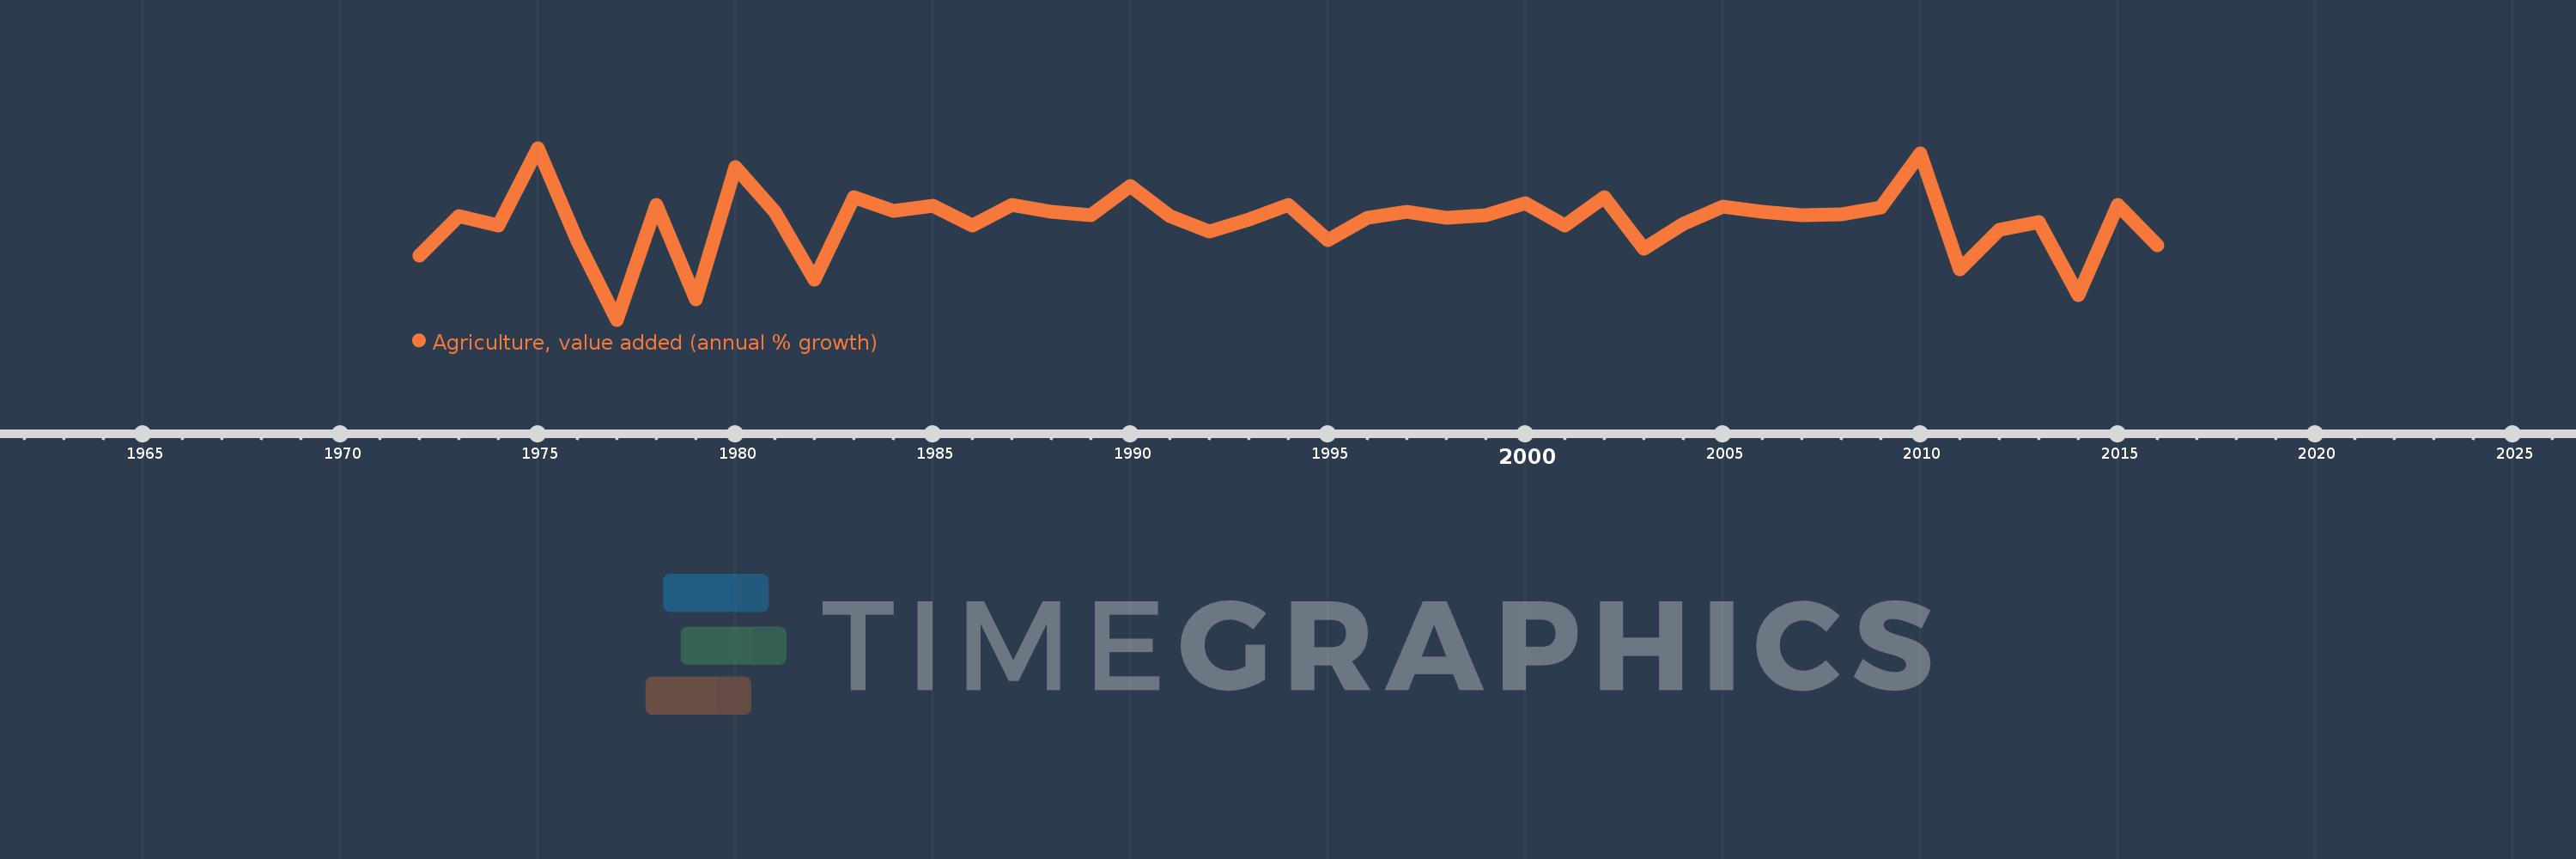
Agriculture, value added (annual % growth)
2016,2015,2014,2013,2012,2011,2010,2009,2008,2007,2006,2005,2004,2003,2002,2001,2000,1999,1998,1997,1996,1995,1994,1993,1992,1991,1990,1989,1988,1987,1986,1985,1984,1983,1982,1981,1980,1979,1978,1977,1976,1975,1974,1973,1972
This statistics in other country:
AfghanistanAlbaniaAlgeriaAntigua and BarbudaArab WorldArgentinaArmeniaAustraliaAustriaAzerbaijanBahamas, TheBahrainBangladeshBelarusBelgiumBelizeBeninBermudaBhutanBoliviaBosnia and HerzegovinaBotswanaBrazilBrunei DarussalamBulgariaBurkina FasoBurundiCabo VerdeCambodiaCameroonCanadaCaribbean small statesCayman IslandsCentral African RepublicCentral Europe and the BalticsChadChileChinaColombiaComorosCongo, Dem. Rep.Congo, Rep.Costa RicaCote d'IvoireCroatiaCubaCyprusCzech RepublicDenmarkDjiboutiDominicaDominican RepublicEarly-demographic dividendEast Asia & PacificEast Asia & Pacific (excluding high income)East Asia & Pacific (IDA & IBRD countries)EcuadorEgypt, Arab Rep.El SalvadorEquatorial GuineaEritreaEstoniaEthiopiaEuro areaEurope & Central AsiaEurope & Central Asia (excluding high income)Europe & Central Asia (IDA & IBRD countries)European UnionFijiFinlandFragile and conflict affected situationsFranceGabonGambia, TheGeorgiaGermanyGhanaGreeceGrenadaGuatemalaGuineaGuinea-BissauGuyanaHaitiHeavily indebted poor countries (HIPC)High incomeHondurasHong Kong SAR, ChinaHungaryIBRD onlyIcelandIDA & IBRD totalIDA blendIDA onlyIDA totalIndiaIndonesiaIran, Islamic Rep.IraqIrelandItalyJamaicaJapanJordanKazakhstanKenyaKiribatiKorea, Rep.KosovoKuwaitKyrgyz RepublicLao PDRLate-demographic dividendLatin America & Caribbean Latin America & Caribbean (excluding high income)Latin America & the Caribbean (IDA & IBRD countries)LatviaLeast developed countries: UN classificationLebanonLesothoLiberiaLithuaniaLow & middle incomeLow incomeLower middle incomeLuxembourgMacedonia, FYRMadagascarMalawiMalaysiaMaldivesMaliMarshall IslandsMauritaniaMauritiusMexicoMicronesia, Fed. Sts.Middle East & North AfricaMiddle East & North Africa (excluding high income)Middle East & North Africa (IDA & IBRD countries)Middle incomeMoldovaMongoliaMontenegroMoroccoMozambiqueMyanmarNamibiaNepalNetherlandsNew ZealandNicaraguaNigerNigeriaNorth AmericaNorwayOECD membersOmanOther small statesPakistanPalauPanamaPapua New GuineaParaguayPeruPhilippinesPolandPortugalPost-demographic dividendPre-demographic dividendPuerto RicoQatarRomaniaRussian FederationRwandaSamoaSao Tome and PrincipeSaudi ArabiaSenegalSerbiaSeychellesSierra LeoneSingaporeSlovak RepublicSloveniaSmall statesSolomon IslandsSomaliaSouth AfricaSouth AsiaSouth Asia (IDA & IBRD)SpainSri LankaSt. Kitts and NevisSt. LuciaSt. Vincent and the GrenadinesSub-Saharan Africa Sub-Saharan Africa (excluding high income)Sub-Saharan Africa (IDA & IBRD countries)SudanSurinameSwazilandSwedenSwitzerlandSyrian Arab RepublicTajikistanTanzaniaThailandTimor-LesteTogoTongaTrinidad and TobagoTunisiaTurkeyTurkmenistanTuvaluUgandaUkraineUnited Arab EmiratesUnited KingdomUnited StatesUpper middle incomeUruguayUzbekistanVanuatuVenezuela, RBVietnamWest Bank and GazaWorldZambiaZimbabwe Timeline:
This timeline shows a graph from 1972 to 2016 of Madagascar. No data until 1971. Number of actual observations by date: 45.
Source name:
World Development Indicators
Source organization:
World Bank national accounts data, and OECD National Accounts data files.
Categories, topics:
Economy & Growth
Last updated:
apr 23, 2017
Indicators value changes by year
Minimum:
-8.653
jan 1, 1977
At the date of observation
Value
Absolute change
Change from previous value
jan 1, 1972
-1.987
-1.987
0.0%
jan 1, 1973
2.078
+4.065
-204.56%
jan 1, 1974
1.085
-0.992
-47.76%
jan 1, 1975
9.128
+8.042
740.94%
jan 1, 1976
-0.492
-9.62
-105.39%
jan 1, 1977
-8.653
-8.161
1.66K%
jan 1, 1978
3.248
+11.9
-137.53%
jan 1, 1979
-6.553
-9.801
-301.78%
jan 1, 1980
7.153
+13.706
-209.16%
jan 1, 1981
2.487
-4.666
-65.23%
jan 1, 1982
-4.47
-6.957
-279.75%
jan 1, 1983
4.011
+8.481
-189.72%
jan 1, 1984
2.571
-1.44
-35.9%
jan 1, 1985
3.133
+0.562
21.87%
jan 1, 1986
1.117
-2.016
-64.33%
jan 1, 1987
3.236
+2.119
189.61%
jan 1, 1988
2.505
-0.731
-22.58%
jan 1, 1989
2.197
-0.308
-12.3%
jan 1, 1990
5.213
+3.016
137.28%
jan 1, 1991
2.079
-3.134
-60.11%
jan 1, 1992
0.509
-1.57
-75.5%
jan 1, 1993
1.705
+1.196
234.68%
jan 1, 1994
3.217
+1.512
88.69%
jan 1, 1995
-0.452
-3.669
-114.05%
jan 1, 1996
1.874
+2.326
-514.56%
jan 1, 1997
2.501
+0.627
33.46%
jan 1, 1998
1.881
-0.62
-24.78%
jan 1, 1999
2.138
+0.257
13.64%
jan 1, 2000
3.411
+1.273
59.55%
jan 1, 2001
1.13
-2.281
-66.86%
jan 1, 2002
4.021
+2.891
255.77%
jan 1, 2003
-1.291
-5.312
-132.12%
jan 1, 2004
1.295
+2.587
-200.31%
jan 1, 2005
3.07
+1.774
136.94%
jan 1, 2006
2.498
-0.571
-18.61%
jan 1, 2007
2.145
-0.353
-14.12%
jan 1, 2008
2.243
+0.097
4.53%
jan 1, 2009
2.946
+0.704
31.38%
jan 1, 2010
8.536
+5.59
189.72%
jan 1, 2011
-3.442
-11.978
-140.33%
jan 1, 2012
0.663
+4.105
-119.27%
jan 1, 2013
1.454
+0.79
119.16%
jan 1, 2014
-6.123
-7.576
-521.16%
jan 1, 2015
3.257
+9.379
-153.19%
jan 1, 2016
-0.947
-4.204
-129.08%
Ranking of countries by current statistics by years


Comments: