29
/
en
AIzaSyAYiBZKx7MnpbEhh9jyipgxe19OcubqV5w
April 1, 2024
256049
Sweden
SWE
true
2
1
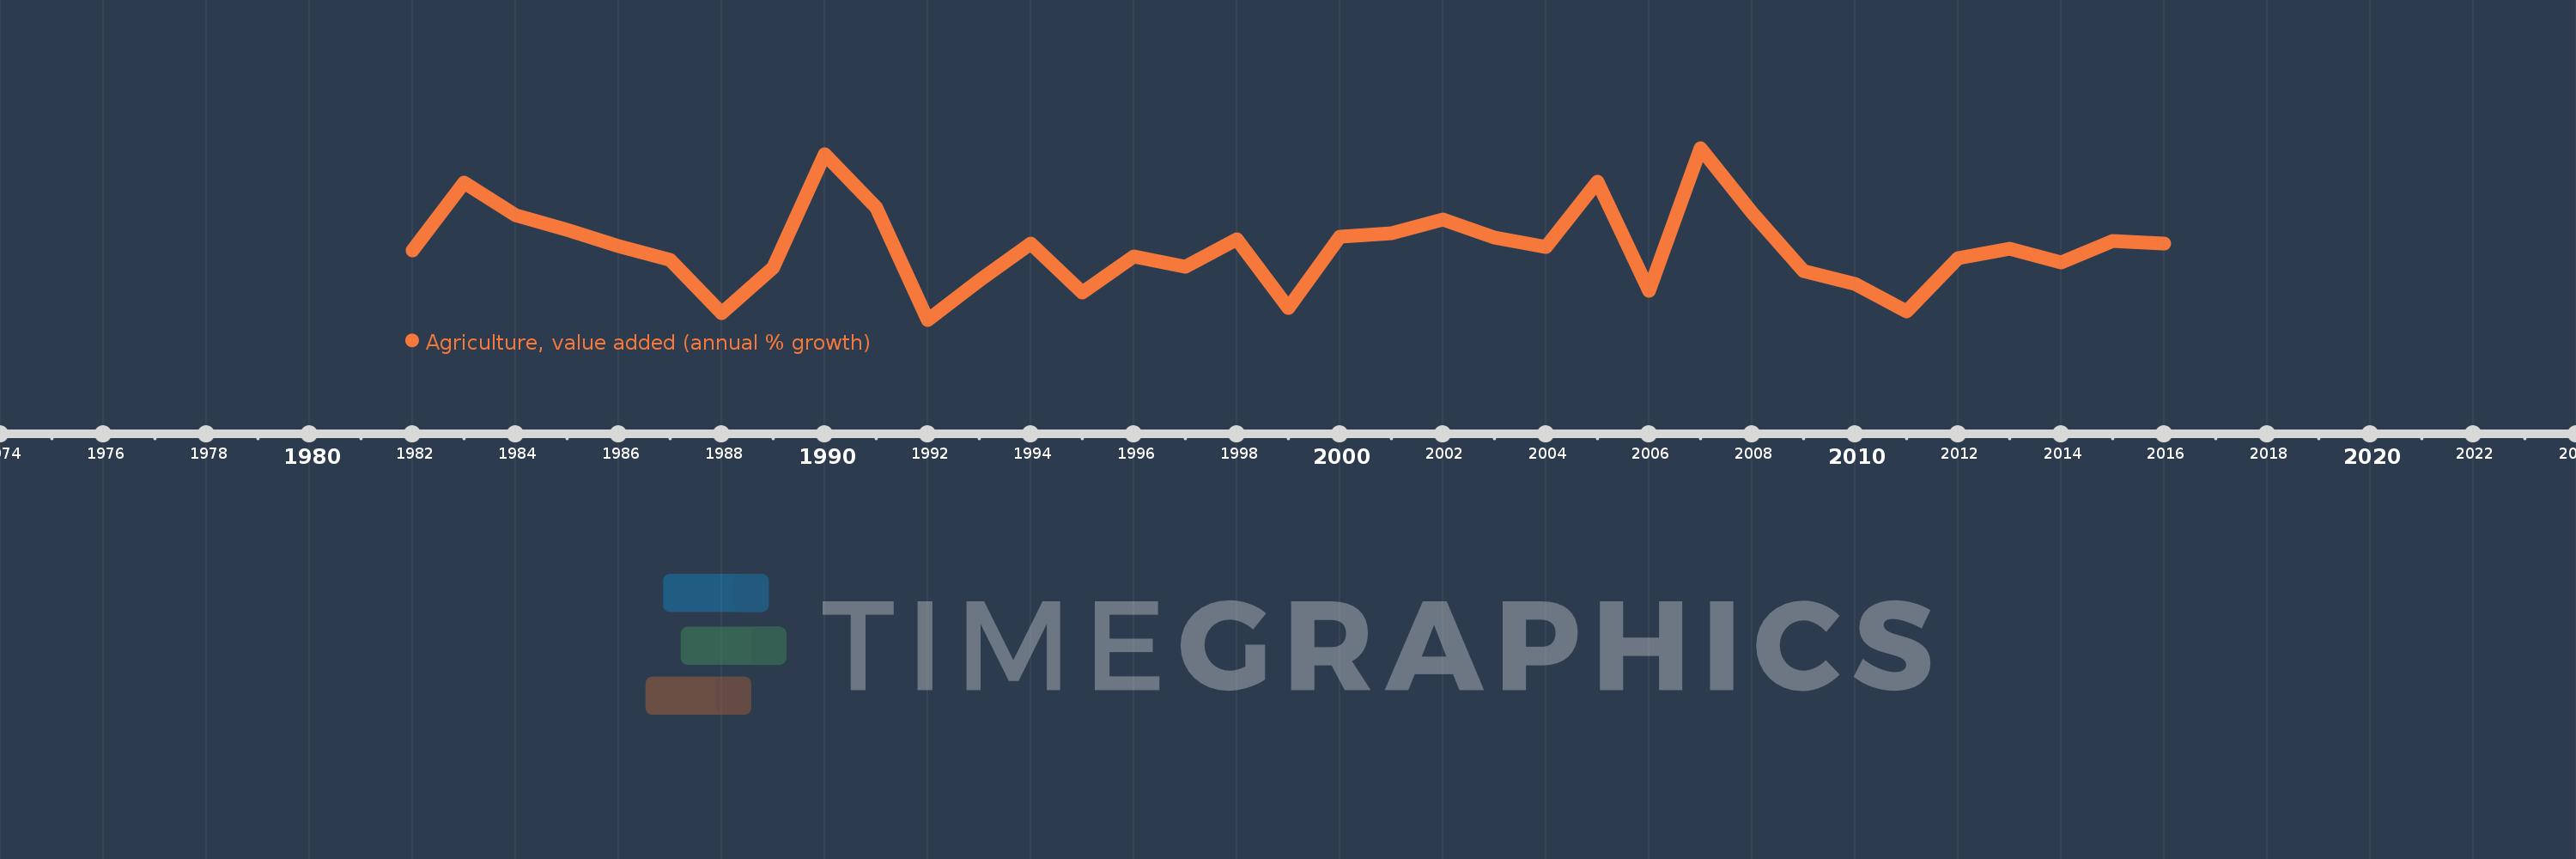
Agriculture, value added (annual % growth)
2016,2015,2014,2013,2012,2011,2010,2009,2008,2007,2006,2005,2004,2003,2002,2001,2000,1999,1998,1997,1996,1995,1994,1993,1992,1991,1990,1989,1988,1987,1986,1985,1984,1983,1982
This statistics in other country:
AfghanistanAlbaniaAlgeriaAntigua and BarbudaArab WorldArgentinaArmeniaAustraliaAustriaAzerbaijanBahamas, TheBahrainBangladeshBelarusBelgiumBelizeBeninBermudaBhutanBoliviaBosnia and HerzegovinaBotswanaBrazilBrunei DarussalamBulgariaBurkina FasoBurundiCabo VerdeCambodiaCameroonCanadaCaribbean small statesCayman IslandsCentral African RepublicCentral Europe and the BalticsChadChileChinaColombiaComorosCongo, Dem. Rep.Congo, Rep.Costa RicaCote d'IvoireCroatiaCubaCyprusCzech RepublicDenmarkDjiboutiDominicaDominican RepublicEarly-demographic dividendEast Asia & PacificEast Asia & Pacific (excluding high income)East Asia & Pacific (IDA & IBRD countries)EcuadorEgypt, Arab Rep.El SalvadorEquatorial GuineaEritreaEstoniaEthiopiaEuro areaEurope & Central AsiaEurope & Central Asia (excluding high income)Europe & Central Asia (IDA & IBRD countries)European UnionFijiFinlandFragile and conflict affected situationsFranceGabonGambia, TheGeorgiaGermanyGhanaGreeceGrenadaGuatemalaGuineaGuinea-BissauGuyanaHaitiHeavily indebted poor countries (HIPC)High incomeHondurasHong Kong SAR, ChinaHungaryIBRD onlyIcelandIDA & IBRD totalIDA blendIDA onlyIDA totalIndiaIndonesiaIran, Islamic Rep.IraqIrelandItalyJamaicaJapanJordanKazakhstanKenyaKiribatiKorea, Rep.KosovoKuwaitKyrgyz RepublicLao PDRLate-demographic dividendLatin America & Caribbean Latin America & Caribbean (excluding high income)Latin America & the Caribbean (IDA & IBRD countries)LatviaLeast developed countries: UN classificationLebanonLesothoLiberiaLithuaniaLow & middle incomeLow incomeLower middle incomeLuxembourgMacedonia, FYRMadagascarMalawiMalaysiaMaldivesMaliMarshall IslandsMauritaniaMauritiusMexicoMicronesia, Fed. Sts.Middle East & North AfricaMiddle East & North Africa (excluding high income)Middle East & North Africa (IDA & IBRD countries)Middle incomeMoldovaMongoliaMontenegroMoroccoMozambiqueMyanmarNamibiaNepalNetherlandsNew ZealandNicaraguaNigerNigeriaNorth AmericaNorwayOECD membersOmanOther small statesPakistanPalauPanamaPapua New GuineaParaguayPeruPhilippinesPolandPortugalPost-demographic dividendPre-demographic dividendPuerto RicoQatarRomaniaRussian FederationRwandaSamoaSao Tome and PrincipeSaudi ArabiaSenegalSerbiaSeychellesSierra LeoneSingaporeSlovak RepublicSloveniaSmall statesSolomon IslandsSomaliaSouth AfricaSouth AsiaSouth Asia (IDA & IBRD)SpainSri LankaSt. Kitts and NevisSt. LuciaSt. Vincent and the GrenadinesSub-Saharan Africa Sub-Saharan Africa (excluding high income)Sub-Saharan Africa (IDA & IBRD countries)SudanSurinameSwazilandSwedenSwitzerlandSyrian Arab RepublicTajikistanTanzaniaThailandTimor-LesteTogoTongaTrinidad and TobagoTunisiaTurkeyTurkmenistanTuvaluUgandaUkraineUnited Arab EmiratesUnited KingdomUnited StatesUpper middle incomeUruguayUzbekistanVanuatuVenezuela, RBVietnamWest Bank and GazaWorldZambiaZimbabwe Timeline:
This timeline shows a graph from 1982 to 2016 of Sweden. No data until 1981. Number of actual observations by date: 35.
Source name:
World Development Indicators
Source organization:
World Bank national accounts data, and OECD National Accounts data files.
Categories, topics:
Economy & Growth
Last updated:
apr 23, 2017
Indicators value changes by year
Minimum:
-6.684
jan 1, 1992
Maximum:
11.819
jan 1, 2007
At the date of observation
Value
Absolute change
Change from previous value
jan 1, 1982
0.779
+0.779
0.0%
jan 1, 1983
8.06
+7.28
934.23%
jan 1, 1984
4.613
-3.447
-42.77%
jan 1, 1985
3.01
-1.603
-34.75%
jan 1, 1986
1.21
-1.799
-59.78%
jan 1, 1987
-0.274
-1.484
-122.61%
jan 1, 1988
-5.985
-5.711
2.09K%
jan 1, 1989
-1.088
+4.897
-81.83%
jan 1, 1990
11.154
+12.242
-1.13K%
jan 1, 1991
5.401
-5.753
-51.58%
jan 1, 1992
-6.684
-12.085
-223.75%
jan 1, 1993
-2.415
+4.269
-63.87%
jan 1, 1994
1.554
+3.968
-164.34%
jan 1, 1995
-3.753
-5.306
-341.54%
jan 1, 1996
0.178
+3.931
-104.75%
jan 1, 1997
-0.951
-1.129
-633.72%
jan 1, 1998
2.013
+2.963
-311.74%
jan 1, 1999
-5.447
-7.46
-370.65%
jan 1, 2000
2.273
+7.72
-141.72%
jan 1, 2001
2.61
+0.338
14.86%
jan 1, 2002
4.147
+1.537
58.86%
jan 1, 2003
2.211
-1.936
-46.68%
jan 1, 2004
1.168
-1.043
-47.16%
jan 1, 2005
8.191
+7.023
601.12%
jan 1, 2006
-3.567
-11.758
-143.55%
jan 1, 2007
11.819
+15.387
-431.33%
jan 1, 2008
4.855
-6.964
-58.92%
jan 1, 2009
-1.45
-6.305
-129.87%
jan 1, 2010
-2.832
-1.382
95.28%
jan 1, 2011
-5.785
-2.954
104.31%
jan 1, 2012
-0.084
+5.702
-98.56%
jan 1, 2013
0.98
+1.063
-1.27K%
jan 1, 2014
-0.554
-1.534
-156.56%
jan 1, 2015
1.802
+2.356
-425.29%
jan 1, 2016
1.527
-0.275
-15.28%
Ranking of countries by current statistics by years


Comments: