29
/
en
AIzaSyAYiBZKx7MnpbEhh9jyipgxe19OcubqV5w
April 1, 2024
43195
Latin America & the Caribbean (IDA & IBRD countries)
TLA
false
2
1
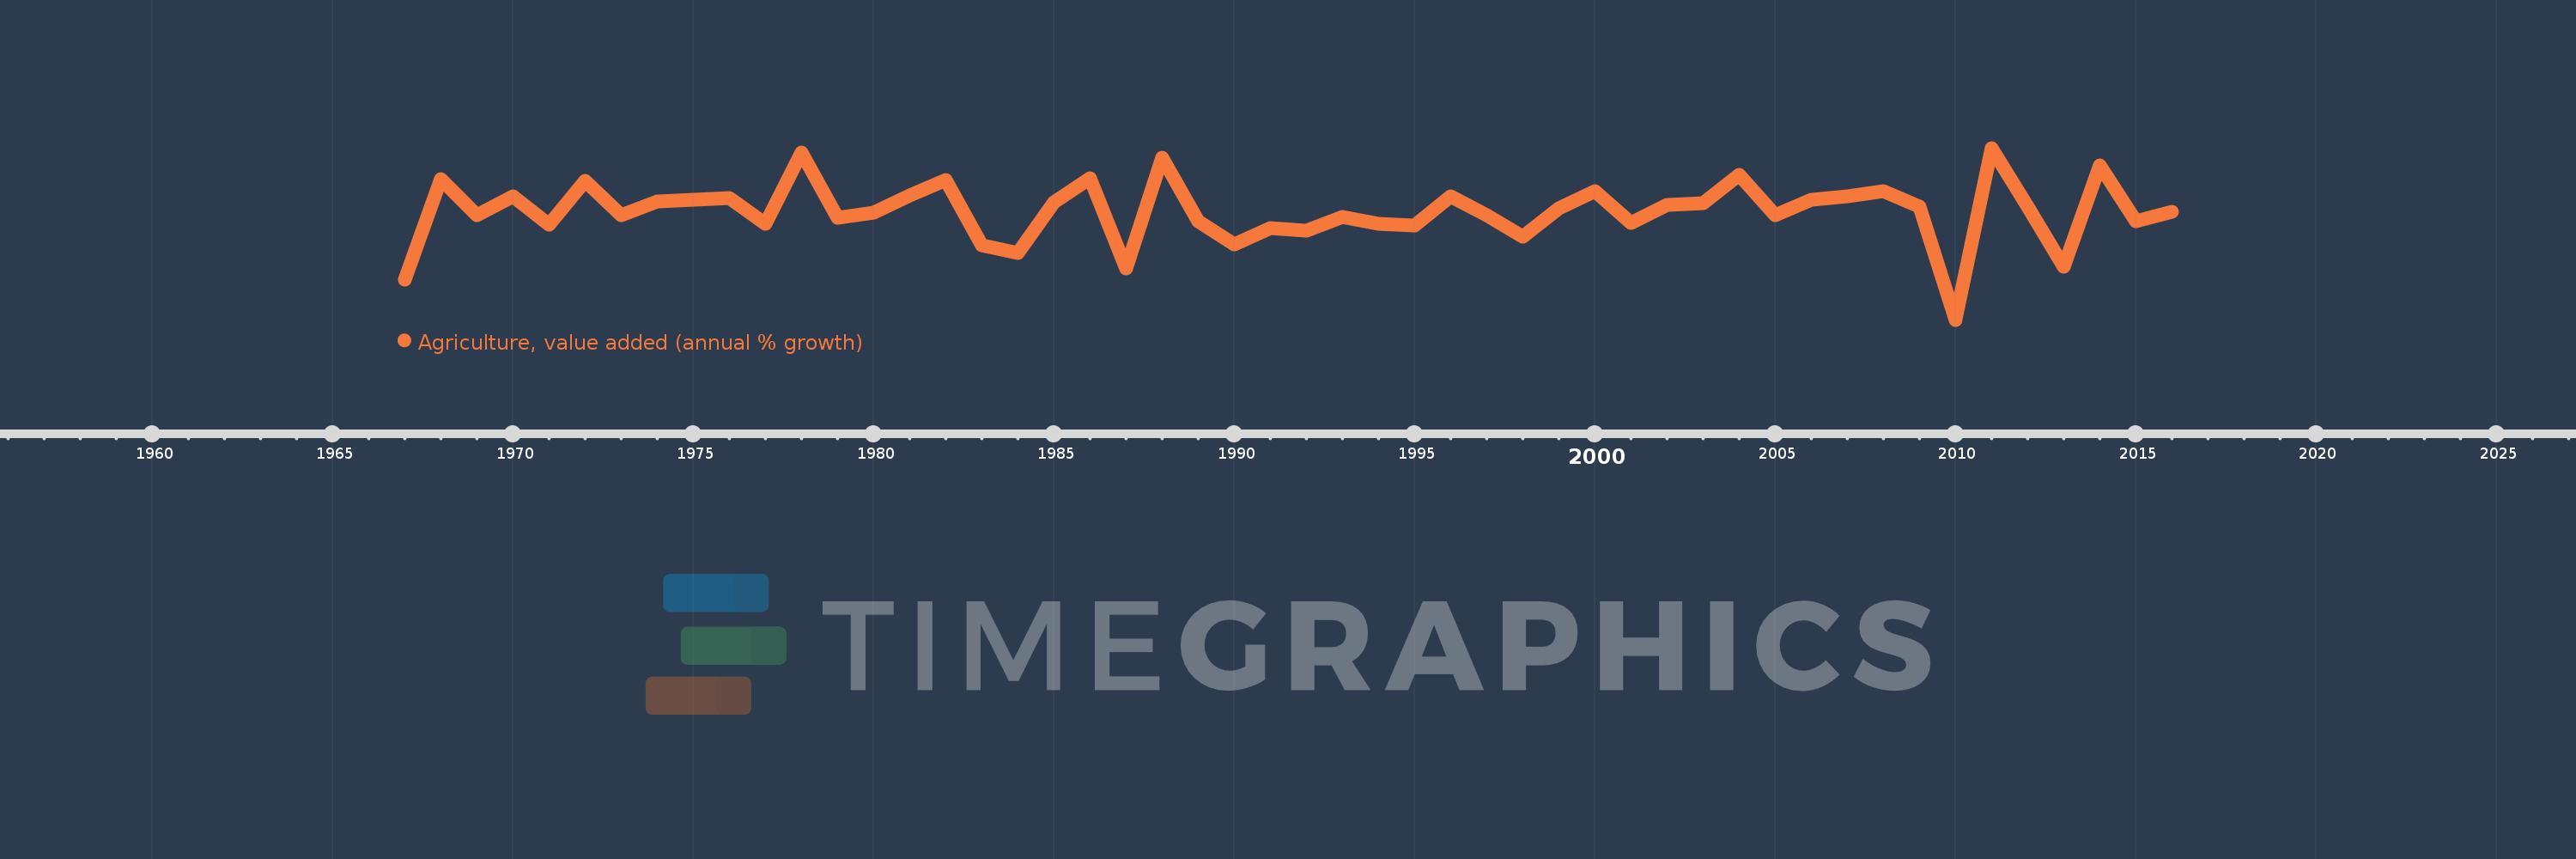
Agriculture, value added (annual % growth)
2016,2015,2014,2013,2012,2011,2010,2009,2008,2007,2006,2005,2004,2003,2002,2001,2000,1999,1998,1997,1996,1995,1994,1993,1992,1991,1990,1989,1988,1987,1986,1985,1984,1983,1982,1981,1980,1979,1978,1977,1976,1975,1974,1973,1972,1971,1970,1969,1968,1967
This statistics in other country:
AfghanistanAlbaniaAlgeriaAntigua and BarbudaArab WorldArgentinaArmeniaAustraliaAustriaAzerbaijanBahamas, TheBahrainBangladeshBelarusBelgiumBelizeBeninBermudaBhutanBoliviaBosnia and HerzegovinaBotswanaBrazilBrunei DarussalamBulgariaBurkina FasoBurundiCabo VerdeCambodiaCameroonCanadaCaribbean small statesCayman IslandsCentral African RepublicCentral Europe and the BalticsChadChileChinaColombiaComorosCongo, Dem. Rep.Congo, Rep.Costa RicaCote d'IvoireCroatiaCubaCyprusCzech RepublicDenmarkDjiboutiDominicaDominican RepublicEarly-demographic dividendEast Asia & PacificEast Asia & Pacific (excluding high income)East Asia & Pacific (IDA & IBRD countries)EcuadorEgypt, Arab Rep.El SalvadorEquatorial GuineaEritreaEstoniaEthiopiaEuro areaEurope & Central AsiaEurope & Central Asia (excluding high income)Europe & Central Asia (IDA & IBRD countries)European UnionFijiFinlandFragile and conflict affected situationsFranceGabonGambia, TheGeorgiaGermanyGhanaGreeceGrenadaGuatemalaGuineaGuinea-BissauGuyanaHaitiHeavily indebted poor countries (HIPC)High incomeHondurasHong Kong SAR, ChinaHungaryIBRD onlyIcelandIDA & IBRD totalIDA blendIDA onlyIDA totalIndiaIndonesiaIran, Islamic Rep.IraqIrelandItalyJamaicaJapanJordanKazakhstanKenyaKiribatiKorea, Rep.KosovoKuwaitKyrgyz RepublicLao PDRLate-demographic dividendLatin America & Caribbean Latin America & Caribbean (excluding high income)Latin America & the Caribbean (IDA & IBRD countries)LatviaLeast developed countries: UN classificationLebanonLesothoLiberiaLithuaniaLow & middle incomeLow incomeLower middle incomeLuxembourgMacedonia, FYRMadagascarMalawiMalaysiaMaldivesMaliMarshall IslandsMauritaniaMauritiusMexicoMicronesia, Fed. Sts.Middle East & North AfricaMiddle East & North Africa (excluding high income)Middle East & North Africa (IDA & IBRD countries)Middle incomeMoldovaMongoliaMontenegroMoroccoMozambiqueMyanmarNamibiaNepalNetherlandsNew ZealandNicaraguaNigerNigeriaNorth AmericaNorwayOECD membersOmanOther small statesPakistanPalauPanamaPapua New GuineaParaguayPeruPhilippinesPolandPortugalPost-demographic dividendPre-demographic dividendPuerto RicoQatarRomaniaRussian FederationRwandaSamoaSao Tome and PrincipeSaudi ArabiaSenegalSerbiaSeychellesSierra LeoneSingaporeSlovak RepublicSloveniaSmall statesSolomon IslandsSomaliaSouth AfricaSouth AsiaSouth Asia (IDA & IBRD)SpainSri LankaSt. Kitts and NevisSt. LuciaSt. Vincent and the GrenadinesSub-Saharan Africa Sub-Saharan Africa (excluding high income)Sub-Saharan Africa (IDA & IBRD countries)SudanSurinameSwazilandSwedenSwitzerlandSyrian Arab RepublicTajikistanTanzaniaThailandTimor-LesteTogoTongaTrinidad and TobagoTunisiaTurkeyTurkmenistanTuvaluUgandaUkraineUnited Arab EmiratesUnited KingdomUnited StatesUpper middle incomeUruguayUzbekistanVanuatuVenezuela, RBVietnamWest Bank and GazaWorldZambiaZimbabwe Timeline:
This timeline shows a graph from 1967 to 2016 of Latin America & the Caribbean (IDA & IBRD countries). No data until 1966. Number of actual observations by date: 50.
Source name:
World Development Indicators
Source organization:
World Bank national accounts data, and OECD National Accounts data files.
Categories, topics:
Economy & Growth
Last updated:
apr 23, 2017
Indicators value changes by year
Minimum:
-5.014
jan 1, 2010
At the date of observation
Value
Absolute change
Change from previous value
jan 1, 1967
-2.166
-2.166
0.0%
jan 1, 1968
4.874
+7.04
-325.04%
jan 1, 1969
2.324
-2.55
-52.32%
jan 1, 1970
3.649
+1.325
57.01%
jan 1, 1971
1.664
-1.985
-54.41%
jan 1, 1972
4.783
+3.12
187.52%
jan 1, 1973
2.327
-2.456
-51.35%
jan 1, 1974
3.313
+0.986
42.38%
jan 1, 1975
3.444
+0.131
3.95%
jan 1, 1976
3.578
+0.134
3.89%
jan 1, 1977
1.763
-1.815
-50.72%
jan 1, 1978
6.765
+5.002
283.71%
jan 1, 1979
2.181
-4.584
-67.76%
jan 1, 1980
2.5
+0.319
14.62%
jan 1, 1981
3.755
+1.254
50.18%
jan 1, 1982
4.838
+1.083
28.85%
jan 1, 1983
0.215
-4.622
-95.55%
jan 1, 1984
-0.293
-0.509
-236.31%
jan 1, 1985
3.25
+3.543
-1.21K%
jan 1, 1986
4.949
+1.699
52.28%
jan 1, 1987
-1.414
-6.363
-128.58%
jan 1, 1988
6.375
+7.789
-550.79%
jan 1, 1989
1.94
-4.435
-69.57%
jan 1, 1990
0.287
-1.653
-85.22%
jan 1, 1991
1.457
+1.17
407.82%
jan 1, 1992
1.272
-0.184
-12.65%
jan 1, 1993
2.196
+0.924
72.59%
jan 1, 1994
1.739
-0.456
-20.79%
jan 1, 1995
1.638
-0.102
-5.84%
jan 1, 1996
3.651
+2.013
122.9%
jan 1, 1997
2.366
-1.285
-35.19%
jan 1, 1998
0.835
-1.531
-64.7%
jan 1, 1999
2.817
+1.982
237.3%
jan 1, 2000
4.05
+1.232
43.73%
jan 1, 2001
1.779
-2.27
-56.07%
jan 1, 2002
3.047
+1.268
71.25%
jan 1, 2003
3.186
+0.139
4.57%
jan 1, 2004
5.183
+1.998
62.7%
jan 1, 2005
2.351
-2.833
-54.65%
jan 1, 2006
3.425
+1.074
45.7%
jan 1, 2007
3.68
+0.255
7.44%
jan 1, 2008
4.025
+0.346
9.39%
jan 1, 2009
2.943
-1.082
-26.88%
jan 1, 2010
-5.014
-7.957
-270.35%
jan 1, 2011
7.072
+12.086
-241.04%
jan 1, 2012
2.962
-4.11
-58.11%
jan 1, 2013
-1.289
-4.251
-143.52%
jan 1, 2014
5.861
+7.15
-554.65%
jan 1, 2015
1.937
-3.924
-66.95%
jan 1, 2016
2.553
+0.615
31.77%
Ranking of countries by current statistics by years


Comments: