29
/
en
AIzaSyAYiBZKx7MnpbEhh9jyipgxe19OcubqV5w
April 1, 2024
110576
Congo, Rep.
COG
true
2
1
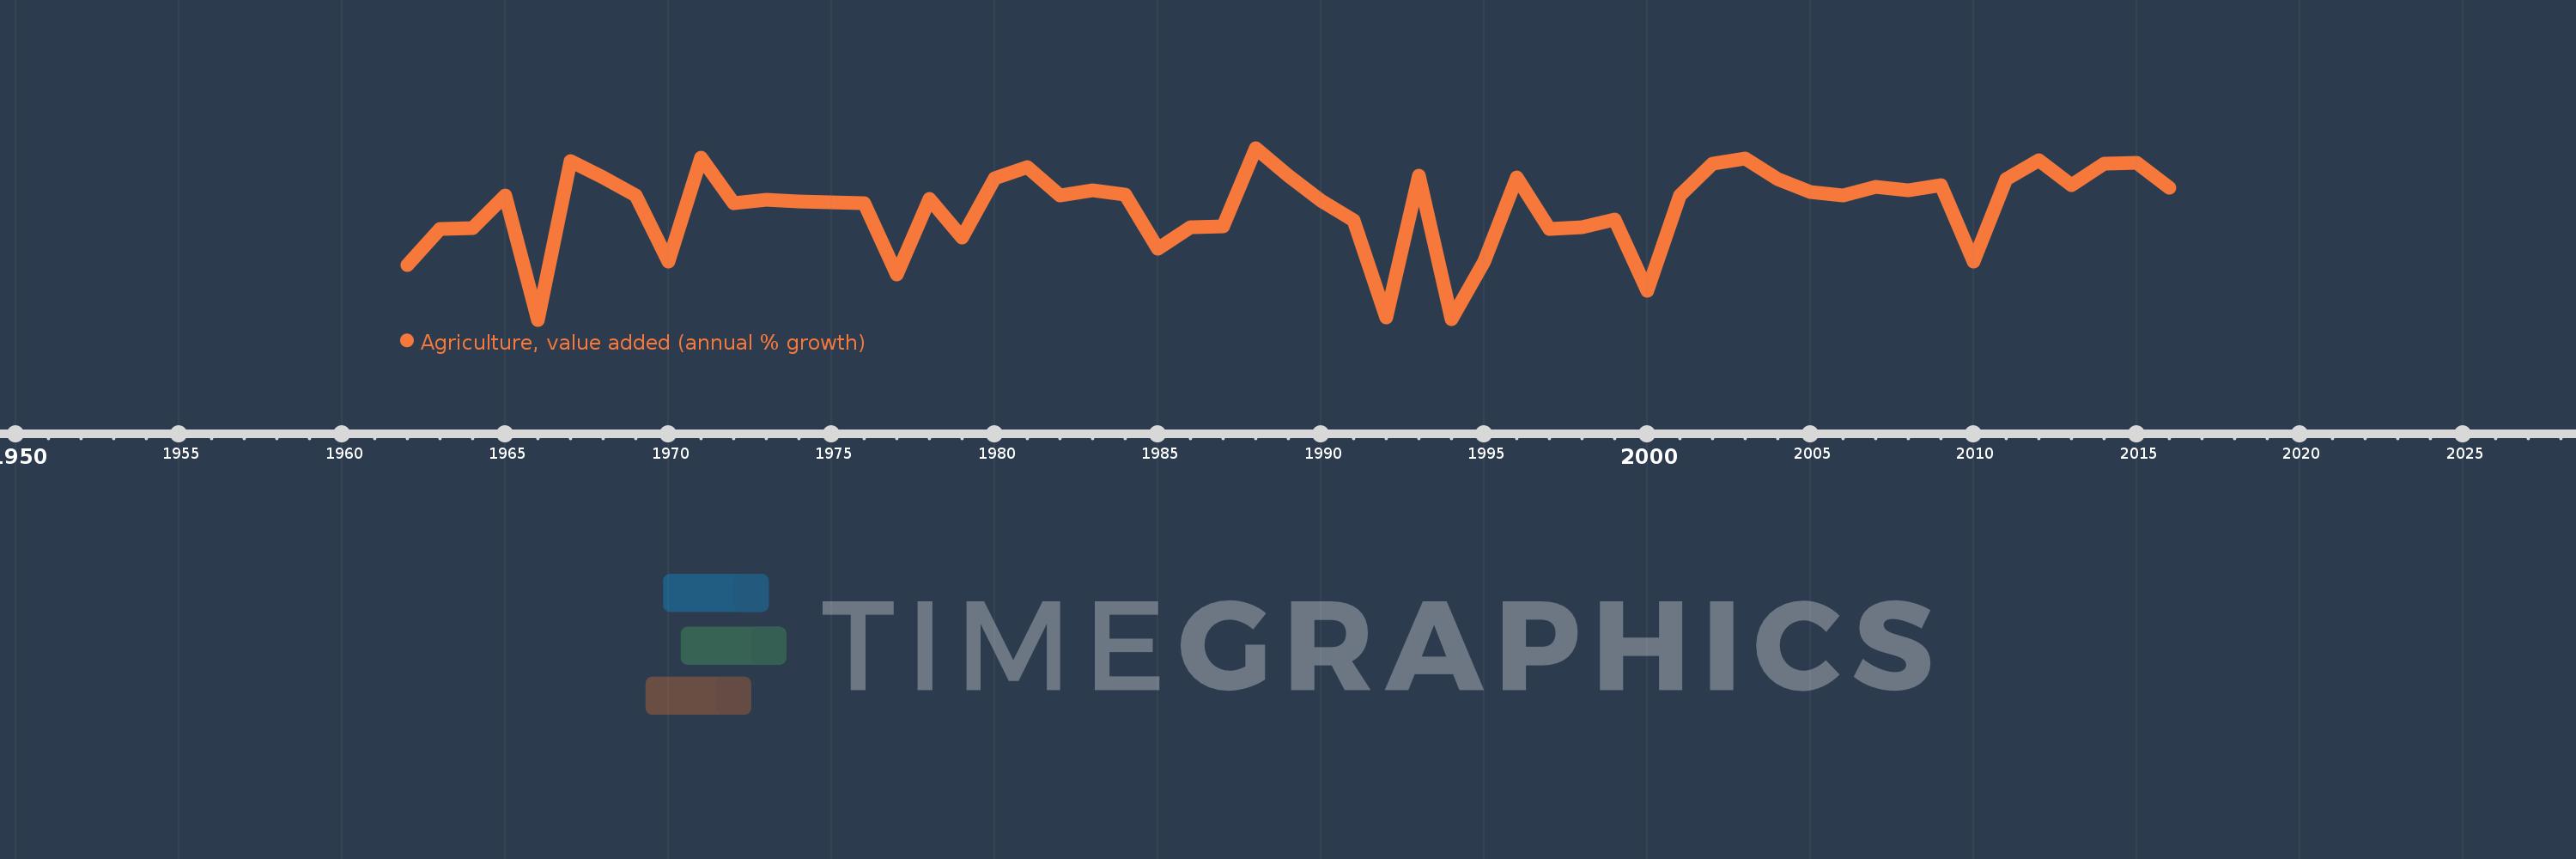
Agriculture, value added (annual % growth)
2016,2015,2014,2013,2012,2011,2010,2009,2008,2007,2006,2005,2004,2003,2002,2001,2000,1999,1998,1997,1996,1995,1994,1993,1992,1991,1990,1989,1988,1987,1986,1985,1984,1983,1982,1981,1980,1979,1978,1977,1976,1975,1974,1973,1972,1971,1970,1969,1968,1967,1966,1965,1964,1963,1962
This statistics in other country:
AfghanistanAlbaniaAlgeriaAntigua and BarbudaArab WorldArgentinaArmeniaAustraliaAustriaAzerbaijanBahamas, TheBahrainBangladeshBelarusBelgiumBelizeBeninBermudaBhutanBoliviaBosnia and HerzegovinaBotswanaBrazilBrunei DarussalamBulgariaBurkina FasoBurundiCabo VerdeCambodiaCameroonCanadaCaribbean small statesCayman IslandsCentral African RepublicCentral Europe and the BalticsChadChileChinaColombiaComorosCongo, Dem. Rep.Congo, Rep.Costa RicaCote d'IvoireCroatiaCubaCyprusCzech RepublicDenmarkDjiboutiDominicaDominican RepublicEarly-demographic dividendEast Asia & PacificEast Asia & Pacific (excluding high income)East Asia & Pacific (IDA & IBRD countries)EcuadorEgypt, Arab Rep.El SalvadorEquatorial GuineaEritreaEstoniaEthiopiaEuro areaEurope & Central AsiaEurope & Central Asia (excluding high income)Europe & Central Asia (IDA & IBRD countries)European UnionFijiFinlandFragile and conflict affected situationsFranceGabonGambia, TheGeorgiaGermanyGhanaGreeceGrenadaGuatemalaGuineaGuinea-BissauGuyanaHaitiHeavily indebted poor countries (HIPC)High incomeHondurasHong Kong SAR, ChinaHungaryIBRD onlyIcelandIDA & IBRD totalIDA blendIDA onlyIDA totalIndiaIndonesiaIran, Islamic Rep.IraqIrelandItalyJamaicaJapanJordanKazakhstanKenyaKiribatiKorea, Rep.KosovoKuwaitKyrgyz RepublicLao PDRLate-demographic dividendLatin America & Caribbean Latin America & Caribbean (excluding high income)Latin America & the Caribbean (IDA & IBRD countries)LatviaLeast developed countries: UN classificationLebanonLesothoLiberiaLithuaniaLow & middle incomeLow incomeLower middle incomeLuxembourgMacedonia, FYRMadagascarMalawiMalaysiaMaldivesMaliMarshall IslandsMauritaniaMauritiusMexicoMicronesia, Fed. Sts.Middle East & North AfricaMiddle East & North Africa (excluding high income)Middle East & North Africa (IDA & IBRD countries)Middle incomeMoldovaMongoliaMontenegroMoroccoMozambiqueMyanmarNamibiaNepalNetherlandsNew ZealandNicaraguaNigerNigeriaNorth AmericaNorwayOECD membersOmanOther small statesPakistanPalauPanamaPapua New GuineaParaguayPeruPhilippinesPolandPortugalPost-demographic dividendPre-demographic dividendPuerto RicoQatarRomaniaRussian FederationRwandaSamoaSao Tome and PrincipeSaudi ArabiaSenegalSerbiaSeychellesSierra LeoneSingaporeSlovak RepublicSloveniaSmall statesSolomon IslandsSomaliaSouth AfricaSouth AsiaSouth Asia (IDA & IBRD)SpainSri LankaSt. Kitts and NevisSt. LuciaSt. Vincent and the GrenadinesSub-Saharan Africa Sub-Saharan Africa (excluding high income)Sub-Saharan Africa (IDA & IBRD countries)SudanSurinameSwazilandSwedenSwitzerlandSyrian Arab RepublicTajikistanTanzaniaThailandTimor-LesteTogoTongaTrinidad and TobagoTunisiaTurkeyTurkmenistanTuvaluUgandaUkraineUnited Arab EmiratesUnited KingdomUnited StatesUpper middle incomeUruguayUzbekistanVanuatuVenezuela, RBVietnamWest Bank and GazaWorldZambiaZimbabwe Timeline:
This timeline shows a graph from 1962 to 2016 of Congo, Rep.. No data until 1961. Number of actual observations by date: 55.
Source name:
World Development Indicators
Source organization:
World Bank national accounts data, and OECD National Accounts data files.
Categories, topics:
Economy & Growth
Last updated:
apr 23, 2017
Indicators value changes by year
Minimum:
-9.816
jan 1, 1966
At the date of observation
Value
Absolute change
Change from previous value
jan 1, 1962
-3.571
-3.571
0.0%
jan 1, 1963
0.602
+4.173
-116.85%
jan 1, 1964
0.699
+0.097
16.16%
jan 1, 1965
4.367
+3.668
524.87%
jan 1, 1966
-9.816
-14.183
-324.77%
jan 1, 1967
8.28
+18.097
-184.36%
jan 1, 1968
6.471
-1.81
-21.86%
jan 1, 1969
4.42
-2.051
-31.7%
jan 1, 1970
-3.175
-7.594
-171.83%
jan 1, 1971
8.743
+11.918
-375.41%
jan 1, 1972
3.518
-5.225
-59.77%
jan 1, 1973
3.883
+0.366
10.39%
jan 1, 1974
3.738
-0.145
-3.73%
jan 1, 1975
3.603
-0.135
-3.61%
jan 1, 1976
3.478
-0.125
-3.47%
jan 1, 1977
-4.622
-8.1
-232.87%
jan 1, 1978
3.965
+8.586
-185.78%
jan 1, 1979
-0.424
-4.388
-110.69%
jan 1, 1980
6.383
+6.807
-1.61K%
jan 1, 1981
7.597
+1.214
19.03%
jan 1, 1982
4.396
-3.202
-42.14%
jan 1, 1983
5.0
+0.604
13.75%
jan 1, 1984
4.511
-0.489
-9.77%
jan 1, 1985
-1.679
-6.19
-137.21%
jan 1, 1986
0.732
+2.41
-143.59%
jan 1, 1987
0.811
+0.079
10.86%
jan 1, 1988
9.816
+9.005
1.11K%
jan 1, 1989
6.64
-3.176
-32.36%
jan 1, 1990
3.778
-2.862
-43.11%
jan 1, 1991
1.581
-2.197
-58.15%
jan 1, 1992
-9.511
-11.092
-701.57%
jan 1, 1993
6.659
+16.17
-170.01%
jan 1, 1994
-9.739
-16.398
-246.26%
jan 1, 1995
-3.187
+6.552
-67.28%
jan 1, 1996
6.47
+9.657
-303.05%
jan 1, 1997
0.54
-5.93
-91.65%
jan 1, 1998
0.791
+0.251
46.48%
jan 1, 1999
1.682
+0.891
112.6%
jan 1, 2000
-6.479
-8.16
-485.27%
jan 1, 2001
4.363
+10.842
-167.35%
jan 1, 2002
8.023
+3.659
83.87%
jan 1, 2003
8.577
+0.555
6.92%
jan 1, 2004
6.262
-2.315
-26.99%
jan 1, 2005
4.805
-1.457
-23.27%
jan 1, 2006
4.412
-0.393
-8.19%
jan 1, 2007
5.385
+0.973
22.07%
jan 1, 2008
5.0
-0.385
-7.15%
jan 1, 2009
5.58
+0.579
11.59%
jan 1, 2010
-3.186
-8.766
-157.11%
jan 1, 2011
6.256
+9.443
-296.34%
jan 1, 2012
8.39
+2.134
34.11%
jan 1, 2013
5.559
-2.831
-33.75%
jan 1, 2014
7.987
+2.429
43.69%
jan 1, 2015
8.069
+0.082
1.02%
jan 1, 2016
5.24
-2.829
-35.06%
Ranking of countries by current statistics by years


Comments: