29
/
en
AIzaSyAYiBZKx7MnpbEhh9jyipgxe19OcubqV5w
April 1, 2024
59517
Sub-Saharan Africa (excluding high income)
SSA
false
2
1
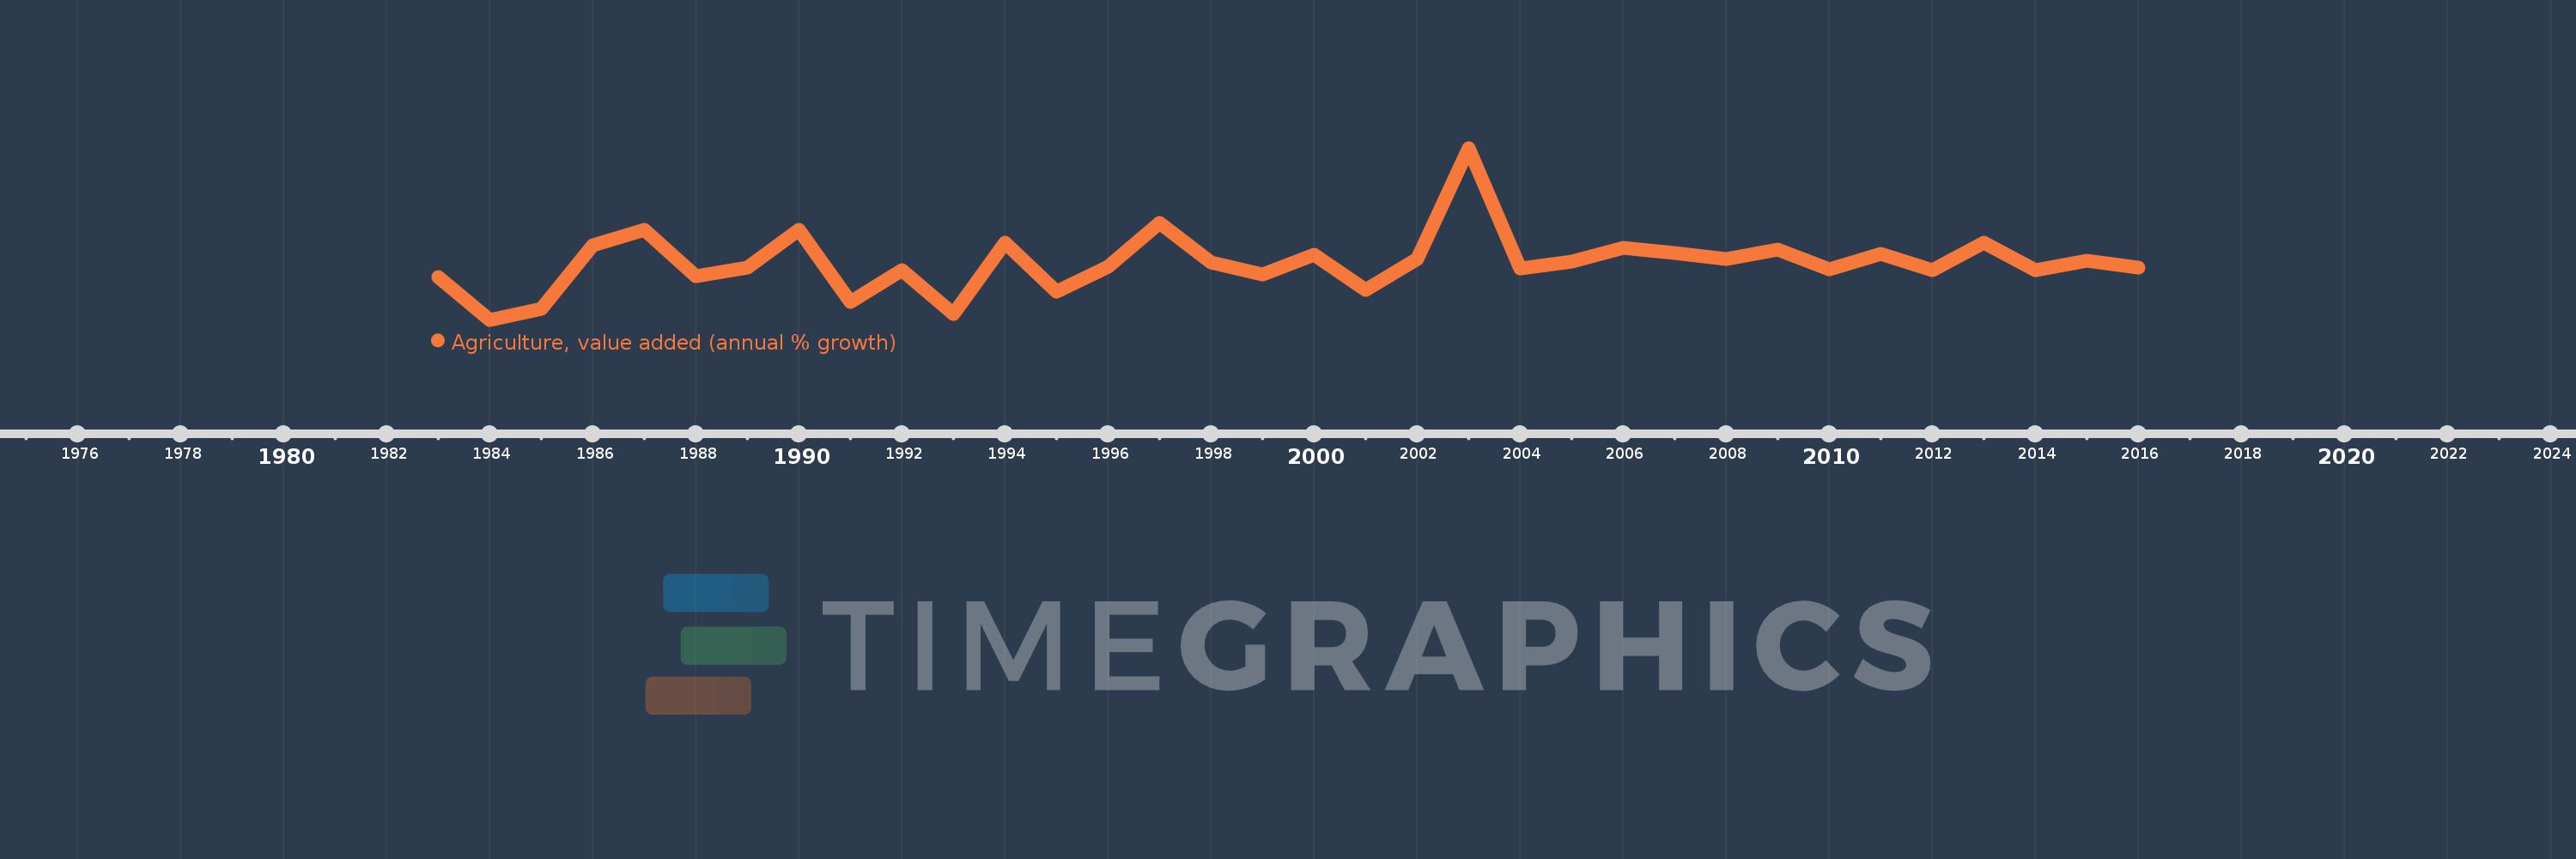
Agriculture, value added (annual % growth)
2016,2015,2014,2013,2012,2011,2010,2009,2008,2007,2006,2005,2004,2003,2002,2001,2000,1999,1998,1997,1996,1995,1994,1993,1992,1991,1990,1989,1988,1987,1986,1985,1984,1983
This statistics in other country:
AfghanistanAlbaniaAlgeriaAntigua and BarbudaArab WorldArgentinaArmeniaAustraliaAustriaAzerbaijanBahamas, TheBahrainBangladeshBelarusBelgiumBelizeBeninBermudaBhutanBoliviaBosnia and HerzegovinaBotswanaBrazilBrunei DarussalamBulgariaBurkina FasoBurundiCabo VerdeCambodiaCameroonCanadaCaribbean small statesCayman IslandsCentral African RepublicCentral Europe and the BalticsChadChileChinaColombiaComorosCongo, Dem. Rep.Congo, Rep.Costa RicaCote d'IvoireCroatiaCubaCyprusCzech RepublicDenmarkDjiboutiDominicaDominican RepublicEarly-demographic dividendEast Asia & PacificEast Asia & Pacific (excluding high income)East Asia & Pacific (IDA & IBRD countries)EcuadorEgypt, Arab Rep.El SalvadorEquatorial GuineaEritreaEstoniaEthiopiaEuro areaEurope & Central AsiaEurope & Central Asia (excluding high income)Europe & Central Asia (IDA & IBRD countries)European UnionFijiFinlandFragile and conflict affected situationsFranceGabonGambia, TheGeorgiaGermanyGhanaGreeceGrenadaGuatemalaGuineaGuinea-BissauGuyanaHaitiHeavily indebted poor countries (HIPC)High incomeHondurasHong Kong SAR, ChinaHungaryIBRD onlyIcelandIDA & IBRD totalIDA blendIDA onlyIDA totalIndiaIndonesiaIran, Islamic Rep.IraqIrelandItalyJamaicaJapanJordanKazakhstanKenyaKiribatiKorea, Rep.KosovoKuwaitKyrgyz RepublicLao PDRLate-demographic dividendLatin America & Caribbean Latin America & Caribbean (excluding high income)Latin America & the Caribbean (IDA & IBRD countries)LatviaLeast developed countries: UN classificationLebanonLesothoLiberiaLithuaniaLow & middle incomeLow incomeLower middle incomeLuxembourgMacedonia, FYRMadagascarMalawiMalaysiaMaldivesMaliMarshall IslandsMauritaniaMauritiusMexicoMicronesia, Fed. Sts.Middle East & North AfricaMiddle East & North Africa (excluding high income)Middle East & North Africa (IDA & IBRD countries)Middle incomeMoldovaMongoliaMontenegroMoroccoMozambiqueMyanmarNamibiaNepalNetherlandsNew ZealandNicaraguaNigerNigeriaNorth AmericaNorwayOECD membersOmanOther small statesPakistanPalauPanamaPapua New GuineaParaguayPeruPhilippinesPolandPortugalPost-demographic dividendPre-demographic dividendPuerto RicoQatarRomaniaRussian FederationRwandaSamoaSao Tome and PrincipeSaudi ArabiaSenegalSerbiaSeychellesSierra LeoneSingaporeSlovak RepublicSloveniaSmall statesSolomon IslandsSomaliaSouth AfricaSouth AsiaSouth Asia (IDA & IBRD)SpainSri LankaSt. Kitts and NevisSt. LuciaSt. Vincent and the GrenadinesSub-Saharan Africa Sub-Saharan Africa (excluding high income)Sub-Saharan Africa (IDA & IBRD countries)SudanSurinameSwazilandSwedenSwitzerlandSyrian Arab RepublicTajikistanTanzaniaThailandTimor-LesteTogoTongaTrinidad and TobagoTunisiaTurkeyTurkmenistanTuvaluUgandaUkraineUnited Arab EmiratesUnited KingdomUnited StatesUpper middle incomeUruguayUzbekistanVanuatuVenezuela, RBVietnamWest Bank and GazaWorldZambiaZimbabwe Timeline:
This timeline shows a graph from 1983 to 2016 of Sub-Saharan Africa (excluding high income). No data until 1982. Number of actual observations by date: 34.
Source name:
World Development Indicators
Source organization:
World Bank national accounts data, and OECD National Accounts data files.
Categories, topics:
Economy & Growth
Last updated:
apr 23, 2017
Indicators value changes by year
Minimum:
-2.535
jan 1, 1984
At the date of observation
Value
Absolute change
Change from previous value
jan 1, 1983
2.202
+2.202
0.0%
jan 1, 1984
-2.535
-4.737
-215.16%
jan 1, 1985
-1.278
+1.257
-49.59%
jan 1, 1986
5.769
+7.047
-551.37%
jan 1, 1987
7.445
+1.676
29.05%
jan 1, 1988
2.259
-5.186
-69.66%
jan 1, 1989
3.285
+1.026
45.44%
jan 1, 1990
7.458
+4.173
127.04%
jan 1, 1991
-0.606
-8.065
-108.13%
jan 1, 1992
2.93
+3.536
-583.29%
jan 1, 1993
-1.94
-4.871
-166.22%
jan 1, 1994
5.988
+7.929
-408.6%
jan 1, 1995
0.544
-5.444
-90.91%
jan 1, 1996
3.348
+2.804
515.05%
jan 1, 1997
8.263
+4.915
146.77%
jan 1, 1998
3.808
-4.455
-53.91%
jan 1, 1999
2.52
-1.288
-33.82%
jan 1, 2000
4.679
+2.159
85.68%
jan 1, 2001
0.787
-3.893
-83.18%
jan 1, 2002
4.219
+3.432
436.11%
jan 1, 2003
16.55
+12.331
292.32%
jan 1, 2004
3.118
-13.432
-81.16%
jan 1, 2005
3.941
+0.823
26.4%
jan 1, 2006
5.481
+1.539
39.05%
jan 1, 2007
4.904
-0.577
-10.52%
jan 1, 2008
4.23
-0.674
-13.73%
jan 1, 2009
5.296
+1.066
25.19%
jan 1, 2010
3.067
-2.229
-42.08%
jan 1, 2011
4.782
+1.715
55.9%
jan 1, 2012
2.963
-1.819
-38.03%
jan 1, 2013
6.016
+3.053
103.02%
jan 1, 2014
2.976
-3.04
-50.53%
jan 1, 2015
4.017
+1.041
34.97%
jan 1, 2016
3.256
-0.76
-18.93%
Ranking of countries by current statistics by years


Comments: