29
/
en
AIzaSyAYiBZKx7MnpbEhh9jyipgxe19OcubqV5w
April 1, 2024
254865
Swaziland
SWZ
true
2
1
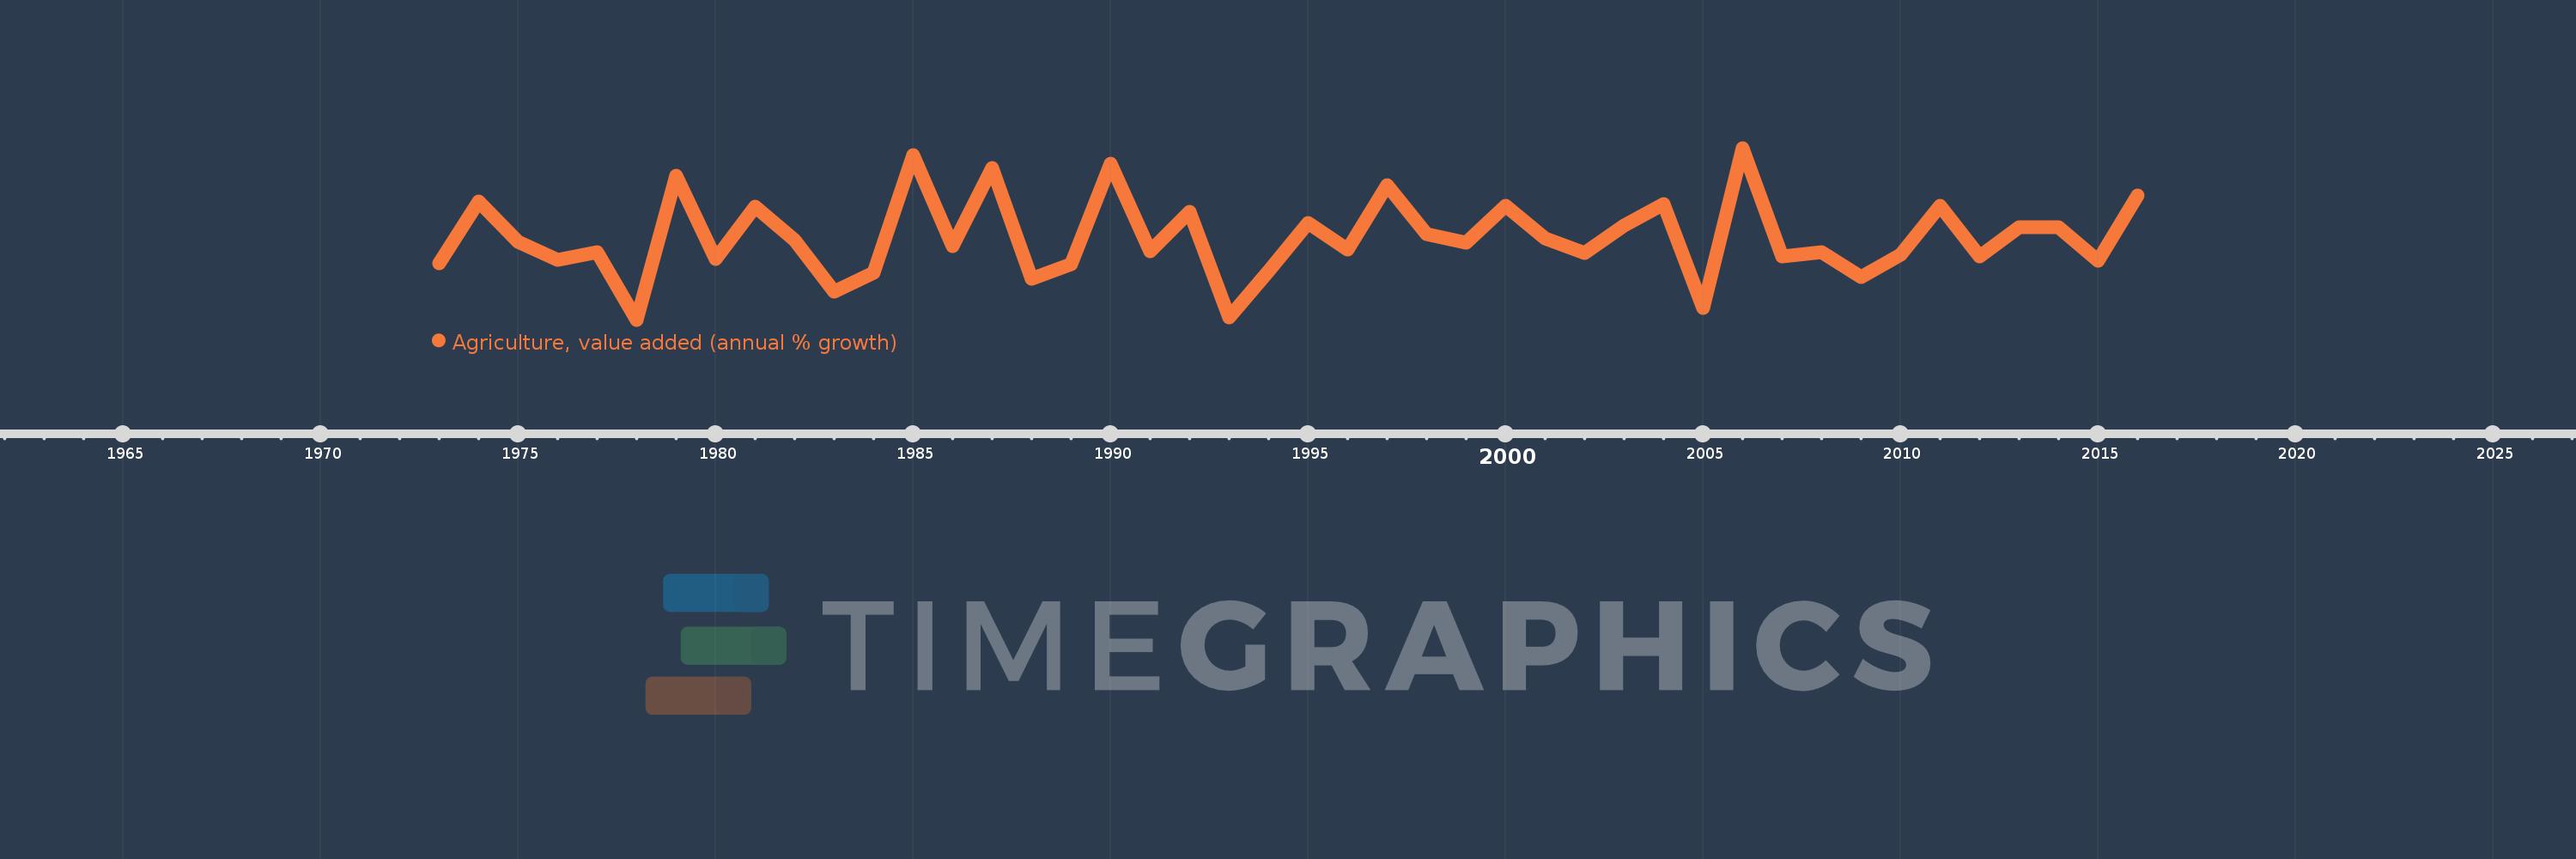
Agriculture, value added (annual % growth)
2016,2015,2014,2013,2012,2011,2010,2009,2008,2007,2006,2005,2004,2003,2002,2001,2000,1999,1998,1997,1996,1995,1994,1993,1992,1991,1990,1989,1988,1987,1986,1985,1984,1983,1982,1981,1980,1979,1978,1977,1976,1975,1974,1973
This statistics in other country:
AfghanistanAlbaniaAlgeriaAntigua and BarbudaArab WorldArgentinaArmeniaAustraliaAustriaAzerbaijanBahamas, TheBahrainBangladeshBelarusBelgiumBelizeBeninBermudaBhutanBoliviaBosnia and HerzegovinaBotswanaBrazilBrunei DarussalamBulgariaBurkina FasoBurundiCabo VerdeCambodiaCameroonCanadaCaribbean small statesCayman IslandsCentral African RepublicCentral Europe and the BalticsChadChileChinaColombiaComorosCongo, Dem. Rep.Congo, Rep.Costa RicaCote d'IvoireCroatiaCubaCyprusCzech RepublicDenmarkDjiboutiDominicaDominican RepublicEarly-demographic dividendEast Asia & PacificEast Asia & Pacific (excluding high income)East Asia & Pacific (IDA & IBRD countries)EcuadorEgypt, Arab Rep.El SalvadorEquatorial GuineaEritreaEstoniaEthiopiaEuro areaEurope & Central AsiaEurope & Central Asia (excluding high income)Europe & Central Asia (IDA & IBRD countries)European UnionFijiFinlandFragile and conflict affected situationsFranceGabonGambia, TheGeorgiaGermanyGhanaGreeceGrenadaGuatemalaGuineaGuinea-BissauGuyanaHaitiHeavily indebted poor countries (HIPC)High incomeHondurasHong Kong SAR, ChinaHungaryIBRD onlyIcelandIDA & IBRD totalIDA blendIDA onlyIDA totalIndiaIndonesiaIran, Islamic Rep.IraqIrelandItalyJamaicaJapanJordanKazakhstanKenyaKiribatiKorea, Rep.KosovoKuwaitKyrgyz RepublicLao PDRLate-demographic dividendLatin America & Caribbean Latin America & Caribbean (excluding high income)Latin America & the Caribbean (IDA & IBRD countries)LatviaLeast developed countries: UN classificationLebanonLesothoLiberiaLithuaniaLow & middle incomeLow incomeLower middle incomeLuxembourgMacedonia, FYRMadagascarMalawiMalaysiaMaldivesMaliMarshall IslandsMauritaniaMauritiusMexicoMicronesia, Fed. Sts.Middle East & North AfricaMiddle East & North Africa (excluding high income)Middle East & North Africa (IDA & IBRD countries)Middle incomeMoldovaMongoliaMontenegroMoroccoMozambiqueMyanmarNamibiaNepalNetherlandsNew ZealandNicaraguaNigerNigeriaNorth AmericaNorwayOECD membersOmanOther small statesPakistanPalauPanamaPapua New GuineaParaguayPeruPhilippinesPolandPortugalPost-demographic dividendPre-demographic dividendPuerto RicoQatarRomaniaRussian FederationRwandaSamoaSao Tome and PrincipeSaudi ArabiaSenegalSerbiaSeychellesSierra LeoneSingaporeSlovak RepublicSloveniaSmall statesSolomon IslandsSomaliaSouth AfricaSouth AsiaSouth Asia (IDA & IBRD)SpainSri LankaSt. Kitts and NevisSt. LuciaSt. Vincent and the GrenadinesSub-Saharan Africa Sub-Saharan Africa (excluding high income)Sub-Saharan Africa (IDA & IBRD countries)SudanSurinameSwazilandSwedenSwitzerlandSyrian Arab RepublicTajikistanTanzaniaThailandTimor-LesteTogoTongaTrinidad and TobagoTunisiaTurkeyTurkmenistanTuvaluUgandaUkraineUnited Arab EmiratesUnited KingdomUnited StatesUpper middle incomeUruguayUzbekistanVanuatuVenezuela, RBVietnamWest Bank and GazaWorldZambiaZimbabwe Timeline:
This timeline shows a graph from 1973 to 2016 of Swaziland. No data until 1972. Number of actual observations by date: 44.
Source name:
World Development Indicators
Source organization:
World Bank national accounts data, and OECD National Accounts data files.
Categories, topics:
Economy & Growth
Last updated:
apr 23, 2017
Indicators value changes by year
Minimum:
-18.984
jan 1, 1978
Maximum:
22.896
jan 1, 2006
At the date of observation
Value
Absolute change
Change from previous value
jan 1, 1973
-5.202
-5.202
0.0%
jan 1, 1974
9.747
+14.949
-287.38%
jan 1, 1975
0.0
-9.747
-100.0%
jan 1, 1976
-4.408
-4.408
%
jan 1, 1977
-2.478
+1.93
-43.79%
jan 1, 1978
-18.984
-16.506
666.21%
jan 1, 1979
16.115
+35.099
-184.89%
jan 1, 1980
-4.126
-20.241
-125.6%
jan 1, 1981
8.635
+12.761
-309.27%
jan 1, 1982
0.479
-8.156
-94.45%
jan 1, 1983
-12.043
-12.522
-2.61K%
jan 1, 1984
-7.579
+4.464
-37.06%
jan 1, 1985
21.164
+28.744
-379.23%
jan 1, 1986
-1.019
-22.183
-104.81%
jan 1, 1987
18.088
+19.107
-1.88K%
jan 1, 1988
-9.091
-27.179
-150.26%
jan 1, 1989
-5.479
+3.611
-39.73%
jan 1, 1990
19.058
+24.537
-447.81%
jan 1, 1991
-2.34
-21.398
-112.28%
jan 1, 1992
7.391
+9.731
-415.8%
jan 1, 1993
-18.318
-25.709
-347.85%
jan 1, 1994
-7.069
+11.249
-61.41%
jan 1, 1995
4.588
+11.657
-164.91%
jan 1, 1996
-1.959
-6.547
-142.69%
jan 1, 1997
13.783
+15.742
-803.6%
jan 1, 1998
1.84
-11.943
-86.65%
jan 1, 1999
-0.155
-1.995
-108.42%
jan 1, 2000
8.78
+8.935
-5.77K%
jan 1, 2001
0.78
-8.0
-91.12%
jan 1, 2002
-2.692
-3.472
-445.36%
jan 1, 2003
3.915
+6.607
-245.42%
jan 1, 2004
9.227
+5.312
135.68%
jan 1, 2005
-16.012
-25.24
-273.53%
jan 1, 2006
22.896
+38.908
-242.99%
jan 1, 2007
-3.52
-26.415
-115.37%
jan 1, 2008
-2.452
+1.067
-30.33%
jan 1, 2009
-8.605
-6.153
250.91%
jan 1, 2010
-3.232
+5.374
-62.45%
jan 1, 2011
8.888
+12.12
-375.04%
jan 1, 2012
-3.461
-12.349
-138.94%
jan 1, 2013
3.479
+6.941
-200.53%
jan 1, 2014
3.585
+0.106
3.05%
jan 1, 2015
-4.494
-8.08
-225.35%
jan 1, 2016
11.313
+15.808
-351.71%
Ranking of countries by current statistics by years


Comments: