29
/
en
AIzaSyAYiBZKx7MnpbEhh9jyipgxe19OcubqV5w
April 1, 2024
192717
Mauritania
MRT
true
2
1
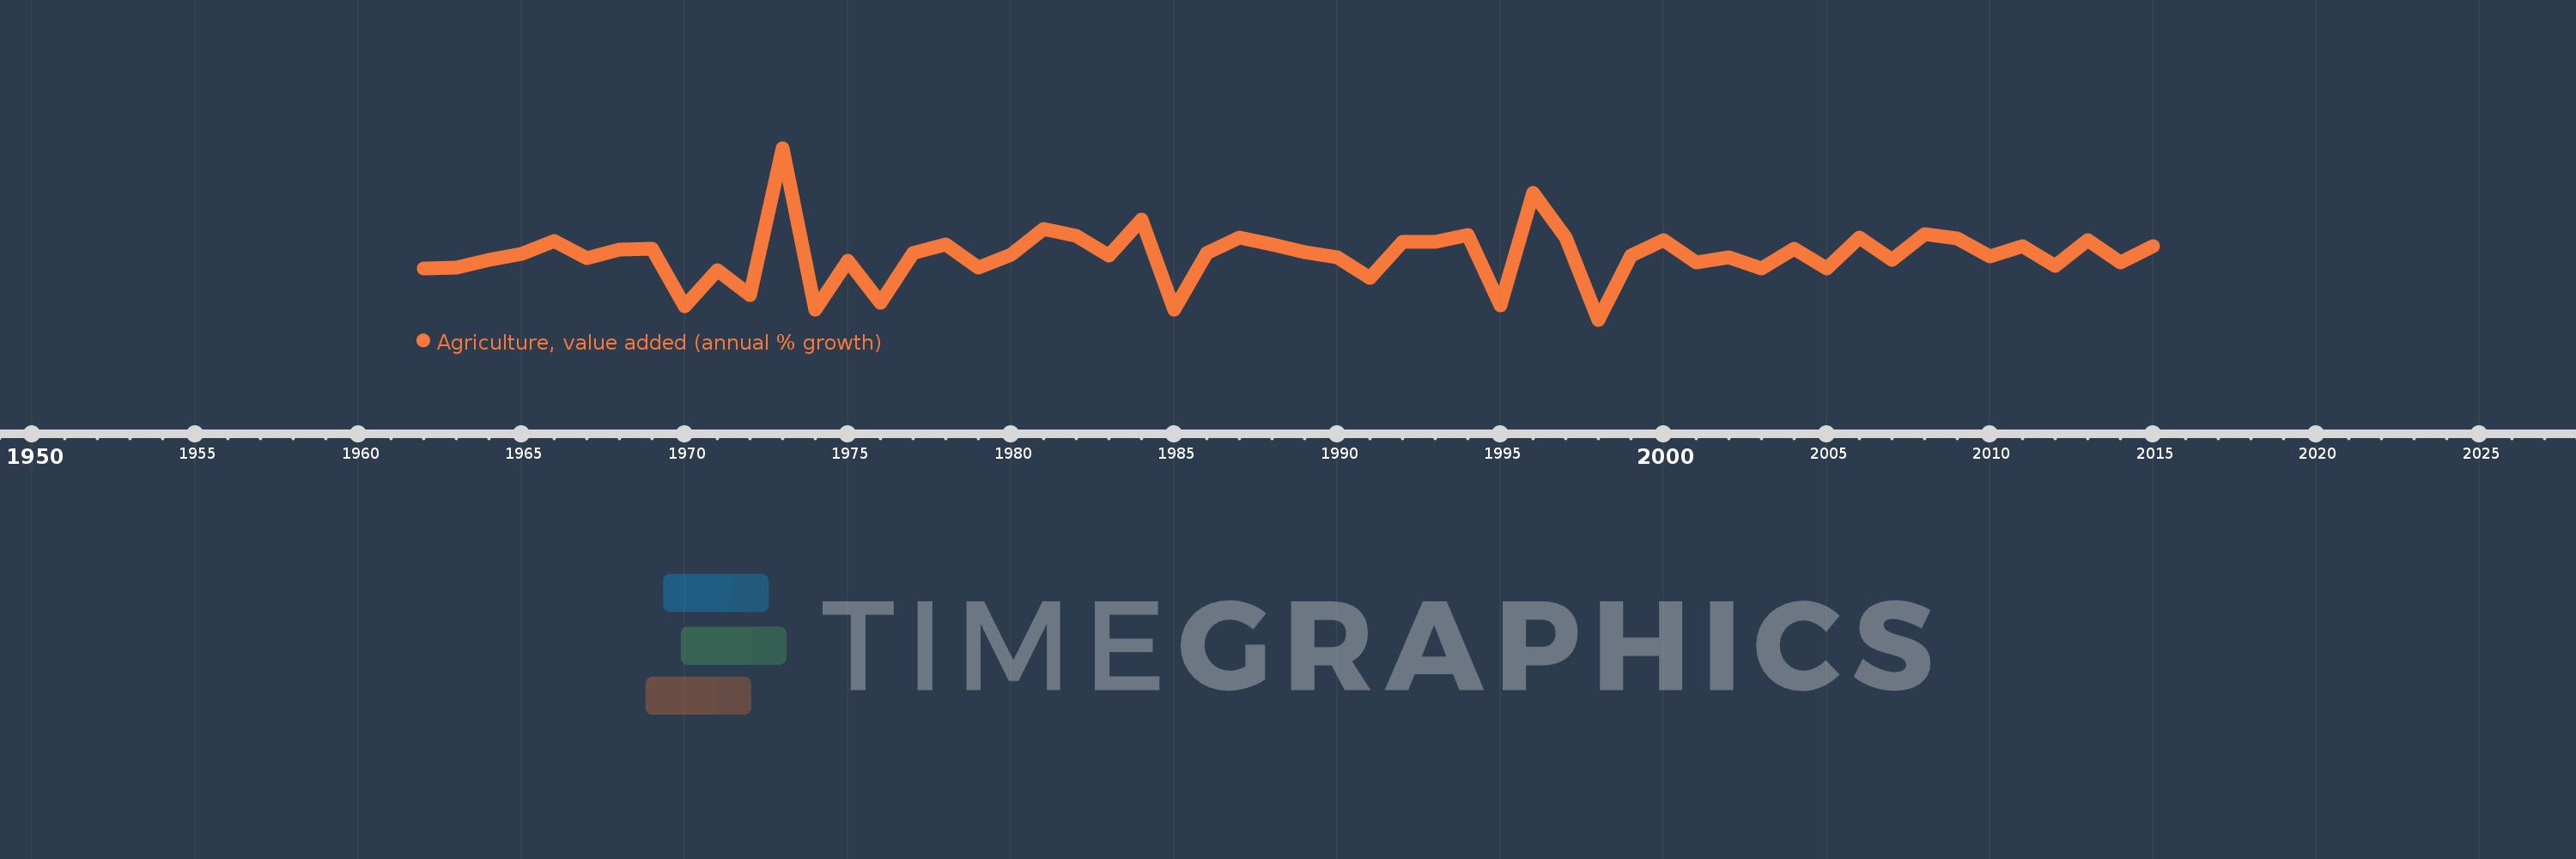
Agriculture, value added (annual % growth)
2015,2014,2013,2012,2011,2010,2009,2008,2007,2006,2005,2004,2003,2002,2001,2000,1999,1998,1997,1996,1995,1994,1993,1992,1991,1990,1989,1988,1987,1986,1985,1984,1983,1982,1981,1980,1979,1978,1977,1976,1975,1974,1973,1972,1971,1970,1969,1968,1967,1966,1965,1964,1963,1962
This statistics in other country:
AfghanistanAlbaniaAlgeriaAntigua and BarbudaArab WorldArgentinaArmeniaAustraliaAustriaAzerbaijanBahamas, TheBahrainBangladeshBelarusBelgiumBelizeBeninBermudaBhutanBoliviaBosnia and HerzegovinaBotswanaBrazilBrunei DarussalamBulgariaBurkina FasoBurundiCabo VerdeCambodiaCameroonCanadaCaribbean small statesCayman IslandsCentral African RepublicCentral Europe and the BalticsChadChileChinaColombiaComorosCongo, Dem. Rep.Congo, Rep.Costa RicaCote d'IvoireCroatiaCubaCyprusCzech RepublicDenmarkDjiboutiDominicaDominican RepublicEarly-demographic dividendEast Asia & PacificEast Asia & Pacific (excluding high income)East Asia & Pacific (IDA & IBRD countries)EcuadorEgypt, Arab Rep.El SalvadorEquatorial GuineaEritreaEstoniaEthiopiaEuro areaEurope & Central AsiaEurope & Central Asia (excluding high income)Europe & Central Asia (IDA & IBRD countries)European UnionFijiFinlandFragile and conflict affected situationsFranceGabonGambia, TheGeorgiaGermanyGhanaGreeceGrenadaGuatemalaGuineaGuinea-BissauGuyanaHaitiHeavily indebted poor countries (HIPC)High incomeHondurasHong Kong SAR, ChinaHungaryIBRD onlyIcelandIDA & IBRD totalIDA blendIDA onlyIDA totalIndiaIndonesiaIran, Islamic Rep.IraqIrelandItalyJamaicaJapanJordanKazakhstanKenyaKiribatiKorea, Rep.KosovoKuwaitKyrgyz RepublicLao PDRLate-demographic dividendLatin America & Caribbean Latin America & Caribbean (excluding high income)Latin America & the Caribbean (IDA & IBRD countries)LatviaLeast developed countries: UN classificationLebanonLesothoLiberiaLithuaniaLow & middle incomeLow incomeLower middle incomeLuxembourgMacedonia, FYRMadagascarMalawiMalaysiaMaldivesMaliMarshall IslandsMauritaniaMauritiusMexicoMicronesia, Fed. Sts.Middle East & North AfricaMiddle East & North Africa (excluding high income)Middle East & North Africa (IDA & IBRD countries)Middle incomeMoldovaMongoliaMontenegroMoroccoMozambiqueMyanmarNamibiaNepalNetherlandsNew ZealandNicaraguaNigerNigeriaNorth AmericaNorwayOECD membersOmanOther small statesPakistanPalauPanamaPapua New GuineaParaguayPeruPhilippinesPolandPortugalPost-demographic dividendPre-demographic dividendPuerto RicoQatarRomaniaRussian FederationRwandaSamoaSao Tome and PrincipeSaudi ArabiaSenegalSerbiaSeychellesSierra LeoneSingaporeSlovak RepublicSloveniaSmall statesSolomon IslandsSomaliaSouth AfricaSouth AsiaSouth Asia (IDA & IBRD)SpainSri LankaSt. Kitts and NevisSt. LuciaSt. Vincent and the GrenadinesSub-Saharan Africa Sub-Saharan Africa (excluding high income)Sub-Saharan Africa (IDA & IBRD countries)SudanSurinameSwazilandSwedenSwitzerlandSyrian Arab RepublicTajikistanTanzaniaThailandTimor-LesteTogoTongaTrinidad and TobagoTunisiaTurkeyTurkmenistanTuvaluUgandaUkraineUnited Arab EmiratesUnited KingdomUnited StatesUpper middle incomeUruguayUzbekistanVanuatuVenezuela, RBVietnamWest Bank and GazaWorldZambiaZimbabwe Timeline:
This timeline shows a graph from 1962 to 2015 of Mauritania. No data until 1961. Number of actual observations by date: 54.
Source name:
World Development Indicators
Source organization:
World Bank national accounts data, and OECD National Accounts data files.
Categories, topics:
Economy & Growth
Last updated:
apr 23, 2017
Indicators value changes by year
Minimum:
-22.233
jan 1, 1998
Maximum:
41.669
jan 1, 1973
At the date of observation
Value
Absolute change
Change from previous value
jan 1, 1962
-3.154
-3.154
0.0%
jan 1, 1963
-2.965
+0.189
-5.99%
jan 1, 1964
0.164
+3.129
-105.55%
jan 1, 1965
2.169
+2.005
1.22K%
jan 1, 1966
7.16
+4.991
230.07%
jan 1, 1967
0.756
-6.404
-89.44%
jan 1, 1968
3.719
+2.963
392.07%
jan 1, 1969
4.065
+0.346
9.3%
jan 1, 1970
-17.237
-21.301
-524.06%
jan 1, 1971
-3.901
+13.336
-77.37%
jan 1, 1972
-13.075
-9.174
235.15%
jan 1, 1973
41.669
+54.744
-418.69%
jan 1, 1974
-18.346
-60.016
-144.03%
jan 1, 1975
-0.334
+18.012
-98.18%
jan 1, 1976
-15.828
-15.494
4.64K%
jan 1, 1977
2.619
+18.447
-116.54%
jan 1, 1978
5.79
+3.171
121.1%
jan 1, 1979
-2.789
-8.579
-148.17%
jan 1, 1980
1.823
+4.612
-165.37%
jan 1, 1981
11.515
+9.691
531.57%
jan 1, 1982
8.92
-2.595
-22.53%
jan 1, 1983
1.665
-7.255
-81.33%
jan 1, 1984
15.073
+13.408
805.2%
jan 1, 1985
-18.443
-33.516
-222.36%
jan 1, 1986
2.458
+20.902
-113.33%
jan 1, 1987
8.346
+5.888
239.48%
jan 1, 1988
5.629
-2.717
-32.56%
jan 1, 1989
3.008
-2.62
-46.55%
jan 1, 1990
1.11
-1.898
-63.09%
jan 1, 1991
-6.58
-7.69
-692.69%
jan 1, 1992
6.865
+13.445
-204.33%
jan 1, 1993
6.865
0.0
0.0%
jan 1, 1994
9.395
+2.53
36.85%
jan 1, 1995
-17.0
-26.395
-280.96%
jan 1, 1996
24.898
+41.899
-246.46%
jan 1, 1997
8.492
-16.406
-65.89%
jan 1, 1998
-22.233
-30.725
-361.79%
jan 1, 1999
1.489
+23.722
-106.7%
jan 1, 2000
7.313
+5.824
391.12%
jan 1, 2001
-0.795
-8.108
-110.87%
jan 1, 2002
0.936
+1.731
-217.72%
jan 1, 2003
-3.061
-3.997
-426.95%
jan 1, 2004
4.264
+7.325
-239.32%
jan 1, 2005
-3.224
-7.488
-175.6%
jan 1, 2006
8.219
+11.443
-354.95%
jan 1, 2007
-0.012
-8.23
-100.14%
jan 1, 2008
9.687
+9.698
-84.2K%
jan 1, 2009
8.043
-1.644
-16.97%
jan 1, 2010
1.259
-6.785
-84.35%
jan 1, 2011
5.222
+3.964
314.92%
jan 1, 2012
-2.162
-7.384
-141.39%
jan 1, 2013
7.511
+9.673
-447.48%
jan 1, 2014
-1.017
-8.528
-113.54%
jan 1, 2015
5.078
+6.095
-599.32%
Ranking of countries by current statistics by years


Comments: