29
/
en
AIzaSyAYiBZKx7MnpbEhh9jyipgxe19OcubqV5w
April 1, 2024
49797
Middle East & North Africa (IDA & IBRD countries)
TMN
false
2
1
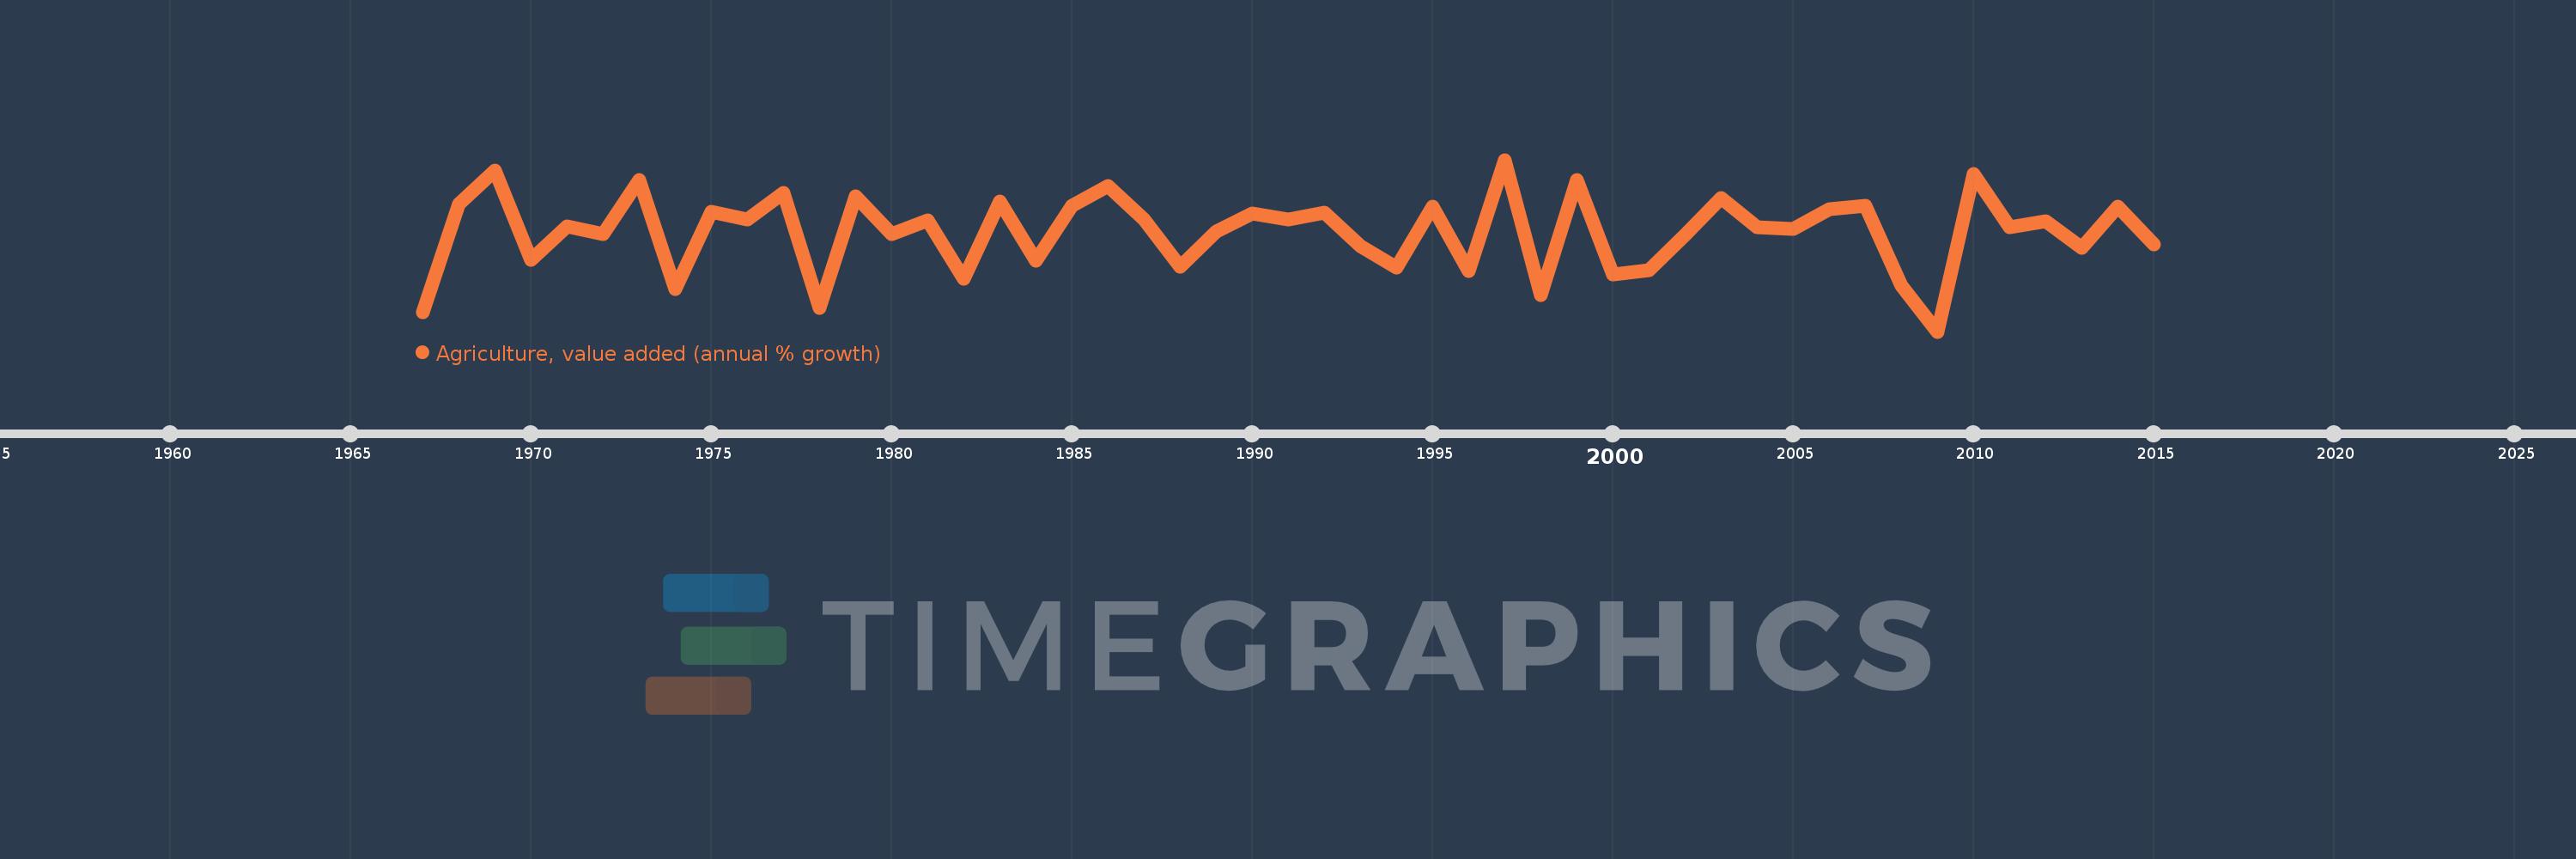
Agriculture, value added (annual % growth)
2015,2014,2013,2012,2011,2010,2009,2008,2007,2006,2005,2004,2003,2002,2001,2000,1999,1998,1997,1996,1995,1994,1993,1992,1991,1990,1989,1988,1987,1986,1985,1984,1983,1982,1981,1980,1979,1978,1977,1976,1975,1974,1973,1972,1971,1970,1969,1968,1967
This statistics in other country:
AfghanistanAlbaniaAlgeriaAntigua and BarbudaArab WorldArgentinaArmeniaAustraliaAustriaAzerbaijanBahamas, TheBahrainBangladeshBelarusBelgiumBelizeBeninBermudaBhutanBoliviaBosnia and HerzegovinaBotswanaBrazilBrunei DarussalamBulgariaBurkina FasoBurundiCabo VerdeCambodiaCameroonCanadaCaribbean small statesCayman IslandsCentral African RepublicCentral Europe and the BalticsChadChileChinaColombiaComorosCongo, Dem. Rep.Congo, Rep.Costa RicaCote d'IvoireCroatiaCubaCyprusCzech RepublicDenmarkDjiboutiDominicaDominican RepublicEarly-demographic dividendEast Asia & PacificEast Asia & Pacific (excluding high income)East Asia & Pacific (IDA & IBRD countries)EcuadorEgypt, Arab Rep.El SalvadorEquatorial GuineaEritreaEstoniaEthiopiaEuro areaEurope & Central AsiaEurope & Central Asia (excluding high income)Europe & Central Asia (IDA & IBRD countries)European UnionFijiFinlandFragile and conflict affected situationsFranceGabonGambia, TheGeorgiaGermanyGhanaGreeceGrenadaGuatemalaGuineaGuinea-BissauGuyanaHaitiHeavily indebted poor countries (HIPC)High incomeHondurasHong Kong SAR, ChinaHungaryIBRD onlyIcelandIDA & IBRD totalIDA blendIDA onlyIDA totalIndiaIndonesiaIran, Islamic Rep.IraqIrelandItalyJamaicaJapanJordanKazakhstanKenyaKiribatiKorea, Rep.KosovoKuwaitKyrgyz RepublicLao PDRLate-demographic dividendLatin America & Caribbean Latin America & Caribbean (excluding high income)Latin America & the Caribbean (IDA & IBRD countries)LatviaLeast developed countries: UN classificationLebanonLesothoLiberiaLithuaniaLow & middle incomeLow incomeLower middle incomeLuxembourgMacedonia, FYRMadagascarMalawiMalaysiaMaldivesMaliMarshall IslandsMauritaniaMauritiusMexicoMicronesia, Fed. Sts.Middle East & North AfricaMiddle East & North Africa (excluding high income)Middle East & North Africa (IDA & IBRD countries)Middle incomeMoldovaMongoliaMontenegroMoroccoMozambiqueMyanmarNamibiaNepalNetherlandsNew ZealandNicaraguaNigerNigeriaNorth AmericaNorwayOECD membersOmanOther small statesPakistanPalauPanamaPapua New GuineaParaguayPeruPhilippinesPolandPortugalPost-demographic dividendPre-demographic dividendPuerto RicoQatarRomaniaRussian FederationRwandaSamoaSao Tome and PrincipeSaudi ArabiaSenegalSerbiaSeychellesSierra LeoneSingaporeSlovak RepublicSloveniaSmall statesSolomon IslandsSomaliaSouth AfricaSouth AsiaSouth Asia (IDA & IBRD)SpainSri LankaSt. Kitts and NevisSt. LuciaSt. Vincent and the GrenadinesSub-Saharan Africa Sub-Saharan Africa (excluding high income)Sub-Saharan Africa (IDA & IBRD countries)SudanSurinameSwazilandSwedenSwitzerlandSyrian Arab RepublicTajikistanTanzaniaThailandTimor-LesteTogoTongaTrinidad and TobagoTunisiaTurkeyTurkmenistanTuvaluUgandaUkraineUnited Arab EmiratesUnited KingdomUnited StatesUpper middle incomeUruguayUzbekistanVanuatuVenezuela, RBVietnamWest Bank and GazaWorldZambiaZimbabwe Timeline:
This timeline shows a graph from 1967 to 2015 of Middle East & North Africa (IDA & IBRD countries). No data until 1966. Number of actual observations by date: 49.
Source name:
World Development Indicators
Source organization:
World Bank national accounts data, and OECD National Accounts data files.
Categories, topics:
Economy & Growth
Last updated:
apr 23, 2017
Indicators value changes by year
Minimum:
-7.768
jan 1, 2009
Maximum:
11.758
jan 1, 1997
At the date of observation
Value
Absolute change
Change from previous value
jan 1, 1967
-5.607
-5.607
0.0%
jan 1, 1968
6.768
+12.374
-220.71%
jan 1, 1969
10.528
+3.76
55.57%
jan 1, 1970
0.411
-10.118
-96.1%
jan 1, 1971
4.239
+3.829
932.6%
jan 1, 1972
3.292
-0.947
-22.33%
jan 1, 1973
9.491
+6.199
188.29%
jan 1, 1974
-2.958
-12.449
-131.16%
jan 1, 1975
5.821
+8.779
-296.8%
jan 1, 1976
5.012
-0.809
-13.89%
jan 1, 1977
7.983
+2.97
59.26%
jan 1, 1978
-5.045
-13.028
-163.21%
jan 1, 1979
7.614
+12.659
-250.91%
jan 1, 1980
3.302
-4.312
-56.63%
jan 1, 1981
4.873
+1.571
47.57%
jan 1, 1982
-1.772
-6.645
-136.37%
jan 1, 1983
7.052
+8.824
-497.9%
jan 1, 1984
0.289
-6.763
-95.9%
jan 1, 1985
6.577
+6.289
2.18K%
jan 1, 1986
8.77
+2.193
33.34%
jan 1, 1987
4.999
-3.772
-43.01%
jan 1, 1988
-0.37
-5.369
-107.4%
jan 1, 1989
3.641
+4.011
-1.08K%
jan 1, 1990
5.688
+2.047
56.22%
jan 1, 1991
5.004
-0.684
-12.03%
jan 1, 1992
5.723
+0.72
14.38%
jan 1, 1993
1.977
-3.746
-65.45%
jan 1, 1994
-0.483
-2.461
-124.44%
jan 1, 1995
6.416
+6.899
-1.43K%
jan 1, 1996
-0.913
-7.329
-114.23%
jan 1, 1997
11.758
+12.671
-1.39K%
jan 1, 1998
-3.622
-15.381
-130.81%
jan 1, 1999
9.474
+13.097
-361.55%
jan 1, 2000
-1.244
-10.718
-113.13%
jan 1, 2001
-0.802
+0.442
-35.5%
jan 1, 2002
3.182
+3.984
-496.7%
jan 1, 2003
7.416
+4.235
133.08%
jan 1, 2004
4.1
-3.317
-44.72%
jan 1, 2005
3.945
-0.155
-3.77%
jan 1, 2006
6.112
+2.167
54.94%
jan 1, 2007
6.57
+0.457
7.48%
jan 1, 2008
-2.545
-9.115
-138.74%
jan 1, 2009
-7.768
-5.223
205.22%
jan 1, 2010
10.111
+17.879
-230.16%
jan 1, 2011
4.052
-6.059
-59.93%
jan 1, 2012
4.823
+0.771
19.04%
jan 1, 2013
1.703
-3.12
-64.68%
jan 1, 2014
6.436
+4.733
277.85%
jan 1, 2015
2.187
-4.25
-66.03%
Ranking of countries by current statistics by years


Comments: