29
/
en
AIzaSyAYiBZKx7MnpbEhh9jyipgxe19OcubqV5w
April 1, 2024
154220
India
IND
true
2
1
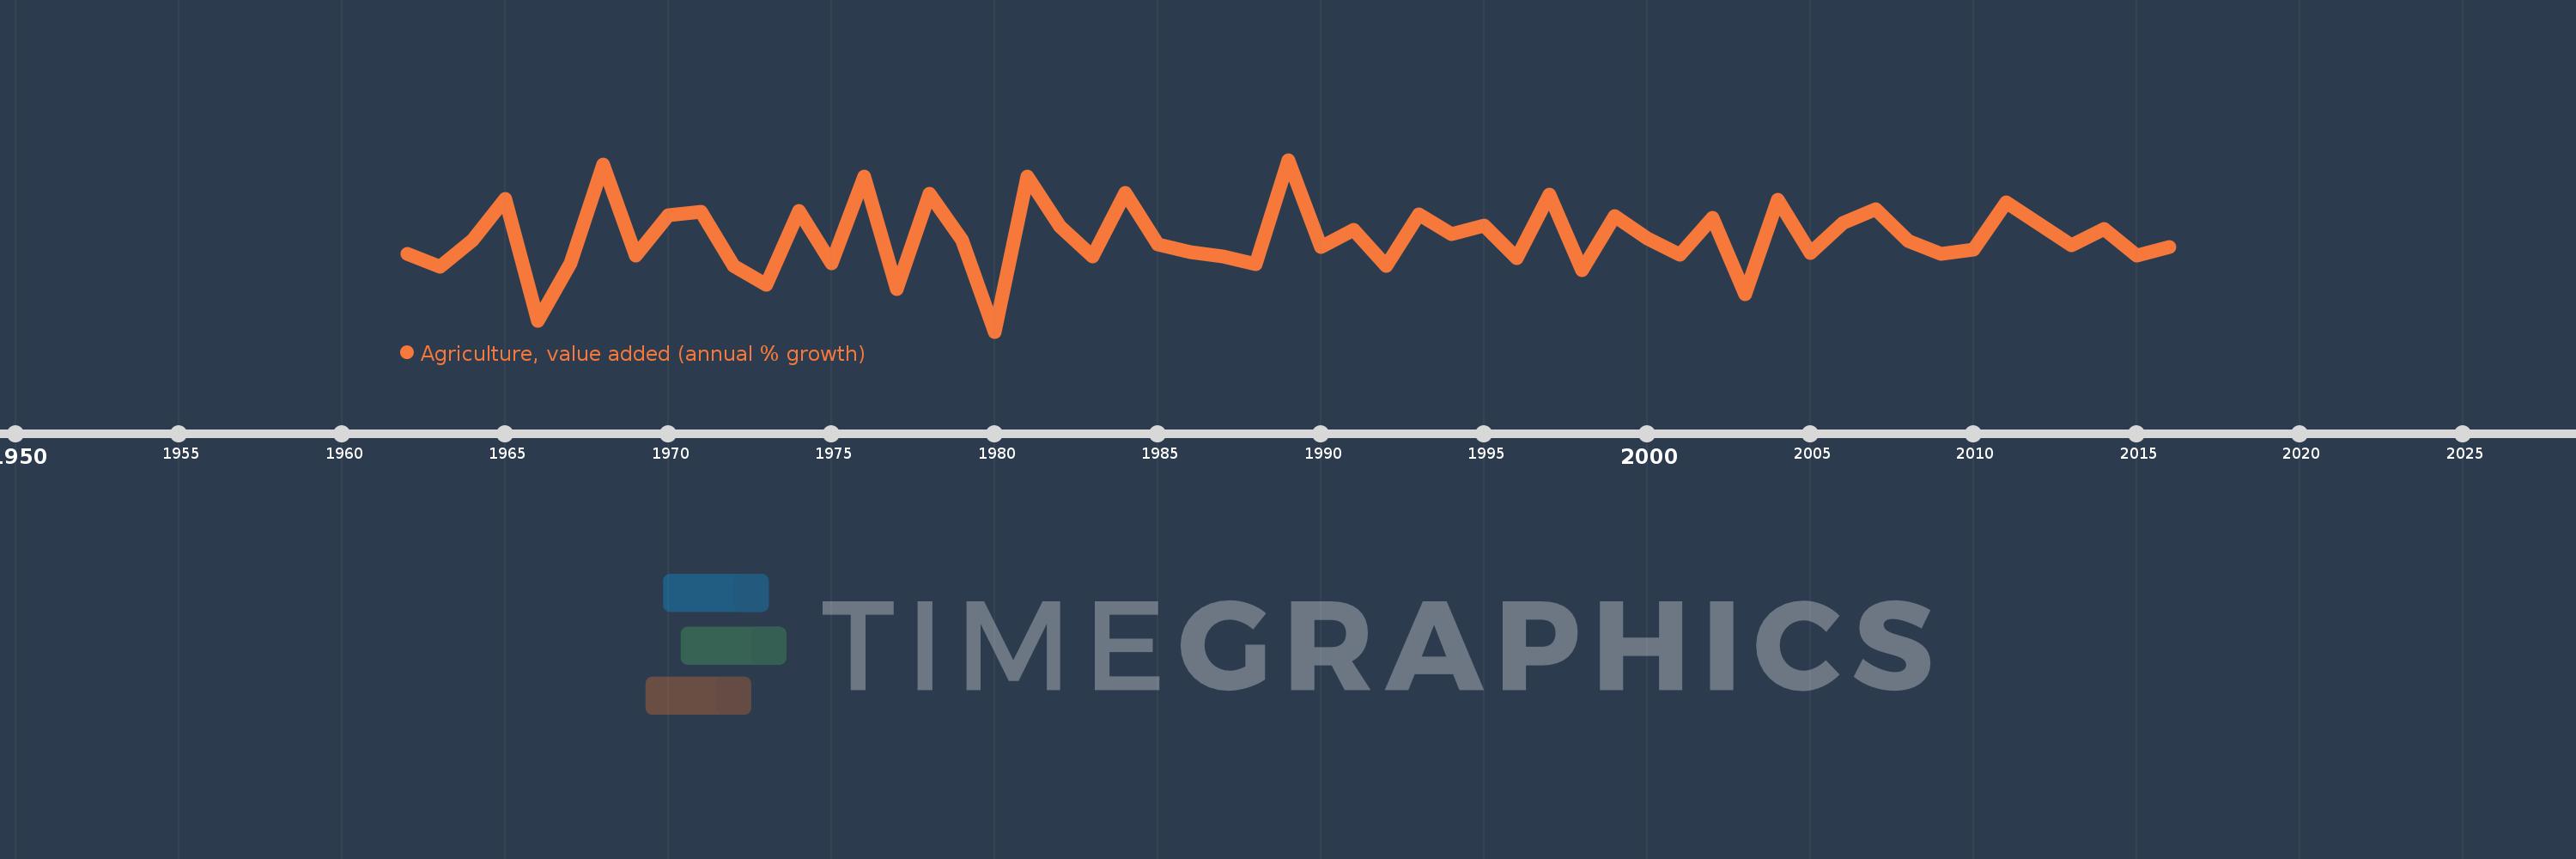
Agriculture, value added (annual % growth)
2016,2015,2014,2013,2012,2011,2010,2009,2008,2007,2006,2005,2004,2003,2002,2001,2000,1999,1998,1997,1996,1995,1994,1993,1992,1991,1990,1989,1988,1987,1986,1985,1984,1983,1982,1981,1980,1979,1978,1977,1976,1975,1974,1973,1972,1971,1970,1969,1968,1967,1966,1965,1964,1963,1962
This statistics in other country:
AfghanistanAlbaniaAlgeriaAntigua and BarbudaArab WorldArgentinaArmeniaAustraliaAustriaAzerbaijanBahamas, TheBahrainBangladeshBelarusBelgiumBelizeBeninBermudaBhutanBoliviaBosnia and HerzegovinaBotswanaBrazilBrunei DarussalamBulgariaBurkina FasoBurundiCabo VerdeCambodiaCameroonCanadaCaribbean small statesCayman IslandsCentral African RepublicCentral Europe and the BalticsChadChileChinaColombiaComorosCongo, Dem. Rep.Congo, Rep.Costa RicaCote d'IvoireCroatiaCubaCyprusCzech RepublicDenmarkDjiboutiDominicaDominican RepublicEarly-demographic dividendEast Asia & PacificEast Asia & Pacific (excluding high income)East Asia & Pacific (IDA & IBRD countries)EcuadorEgypt, Arab Rep.El SalvadorEquatorial GuineaEritreaEstoniaEthiopiaEuro areaEurope & Central AsiaEurope & Central Asia (excluding high income)Europe & Central Asia (IDA & IBRD countries)European UnionFijiFinlandFragile and conflict affected situationsFranceGabonGambia, TheGeorgiaGermanyGhanaGreeceGrenadaGuatemalaGuineaGuinea-BissauGuyanaHaitiHeavily indebted poor countries (HIPC)High incomeHondurasHong Kong SAR, ChinaHungaryIBRD onlyIcelandIDA & IBRD totalIDA blendIDA onlyIDA totalIndiaIndonesiaIran, Islamic Rep.IraqIrelandItalyJamaicaJapanJordanKazakhstanKenyaKiribatiKorea, Rep.KosovoKuwaitKyrgyz RepublicLao PDRLate-demographic dividendLatin America & Caribbean Latin America & Caribbean (excluding high income)Latin America & the Caribbean (IDA & IBRD countries)LatviaLeast developed countries: UN classificationLebanonLesothoLiberiaLithuaniaLow & middle incomeLow incomeLower middle incomeLuxembourgMacedonia, FYRMadagascarMalawiMalaysiaMaldivesMaliMarshall IslandsMauritaniaMauritiusMexicoMicronesia, Fed. Sts.Middle East & North AfricaMiddle East & North Africa (excluding high income)Middle East & North Africa (IDA & IBRD countries)Middle incomeMoldovaMongoliaMontenegroMoroccoMozambiqueMyanmarNamibiaNepalNetherlandsNew ZealandNicaraguaNigerNigeriaNorth AmericaNorwayOECD membersOmanOther small statesPakistanPalauPanamaPapua New GuineaParaguayPeruPhilippinesPolandPortugalPost-demographic dividendPre-demographic dividendPuerto RicoQatarRomaniaRussian FederationRwandaSamoaSao Tome and PrincipeSaudi ArabiaSenegalSerbiaSeychellesSierra LeoneSingaporeSlovak RepublicSloveniaSmall statesSolomon IslandsSomaliaSouth AfricaSouth AsiaSouth Asia (IDA & IBRD)SpainSri LankaSt. Kitts and NevisSt. LuciaSt. Vincent and the GrenadinesSub-Saharan Africa Sub-Saharan Africa (excluding high income)Sub-Saharan Africa (IDA & IBRD countries)SudanSurinameSwazilandSwedenSwitzerlandSyrian Arab RepublicTajikistanTanzaniaThailandTimor-LesteTogoTongaTrinidad and TobagoTunisiaTurkeyTurkmenistanTuvaluUgandaUkraineUnited Arab EmiratesUnited KingdomUnited StatesUpper middle incomeUruguayUzbekistanVanuatuVenezuela, RBVietnamWest Bank and GazaWorldZambiaZimbabwe Timeline:
This timeline shows a graph from 1962 to 2016 of India. No data until 1961. Number of actual observations by date: 55.
Source name:
World Development Indicators
Source organization:
World Bank national accounts data, and OECD National Accounts data files.
Categories, topics:
Economy & Growth
Last updated:
apr 23, 2017
Indicators value changes by year
Minimum:
-12.775
jan 1, 1980
At the date of observation
Value
Absolute change
Change from previous value
jan 1, 1962
0.084
+0.084
0.0%
jan 1, 1963
-1.989
-2.073
-2.46K%
jan 1, 1964
2.339
+4.328
-217.6%
jan 1, 1965
9.224
+6.885
294.33%
jan 1, 1966
-11.042
-20.266
-219.71%
jan 1, 1967
-1.423
+9.62
-87.12%
jan 1, 1968
14.871
+16.293
-1.15K%
jan 1, 1969
-0.158
-15.029
-101.06%
jan 1, 1970
6.428
+6.586
-4.16K%
jan 1, 1971
7.092
+0.665
10.34%
jan 1, 1972
-1.877
-8.97
-126.47%
jan 1, 1973
-5.018
-3.141
167.31%
jan 1, 1974
7.202
+12.22
-243.51%
jan 1, 1975
-1.523
-8.725
-121.15%
jan 1, 1976
12.89
+14.413
-946.14%
jan 1, 1977
-5.778
-18.668
-144.83%
jan 1, 1978
10.036
+15.814
-273.69%
jan 1, 1979
2.303
-7.734
-77.06%
jan 1, 1980
-12.775
-15.077
-654.82%
jan 1, 1981
12.888
+25.663
-200.89%
jan 1, 1982
4.602
-8.287
-64.3%
jan 1, 1983
-0.281
-4.883
-106.1%
jan 1, 1984
10.121
+10.402
-3.7K%
jan 1, 1985
1.585
-8.536
-84.34%
jan 1, 1986
0.314
-1.271
-80.17%
jan 1, 1987
-0.409
-0.724
-230.3%
jan 1, 1988
-1.588
-1.178
287.76%
jan 1, 1989
15.64
+17.227
-1.08K%
jan 1, 1990
1.189
-14.45
-92.4%
jan 1, 1991
4.015
+2.826
237.64%
jan 1, 1992
-1.952
-5.968
-148.63%
jan 1, 1993
6.651
+8.603
-440.64%
jan 1, 1994
3.323
-3.328
-50.04%
jan 1, 1995
4.716
+1.393
41.93%
jan 1, 1996
-0.695
-5.411
-114.75%
jan 1, 1997
9.92
+10.616
-1.53K%
jan 1, 1998
-2.554
-12.474
-125.74%
jan 1, 1999
6.32
+8.874
-347.5%
jan 1, 2000
2.669
-3.651
-57.77%
jan 1, 2001
-0.008
-2.677
-100.29%
jan 1, 2002
6.007
+6.015
-78.95K%
jan 1, 2003
-6.604
-12.611
-209.94%
jan 1, 2004
9.049
+15.653
-237.01%
jan 1, 2005
0.184
-8.865
-97.97%
jan 1, 2006
5.14
+4.956
2.7K%
jan 1, 2007
7.502
+2.363
45.97%
jan 1, 2008
2.246
-5.256
-70.06%
jan 1, 2009
0.093
-2.153
-95.86%
jan 1, 2010
0.808
+0.715
769.14%
jan 1, 2011
8.597
+7.789
964.02%
jan 1, 2012
5.018
-3.58
-41.64%
jan 1, 2013
1.504
-3.514
-70.03%
jan 1, 2014
4.188
+2.684
178.5%
jan 1, 2015
-0.248
-4.436
-105.93%
jan 1, 2016
1.247
+1.495
-602.11%
Ranking of countries by current statistics by years


Comments: