29
/
en
AIzaSyAYiBZKx7MnpbEhh9jyipgxe19OcubqV5w
April 1, 2024
201219
Morocco
MAR
true
2
1
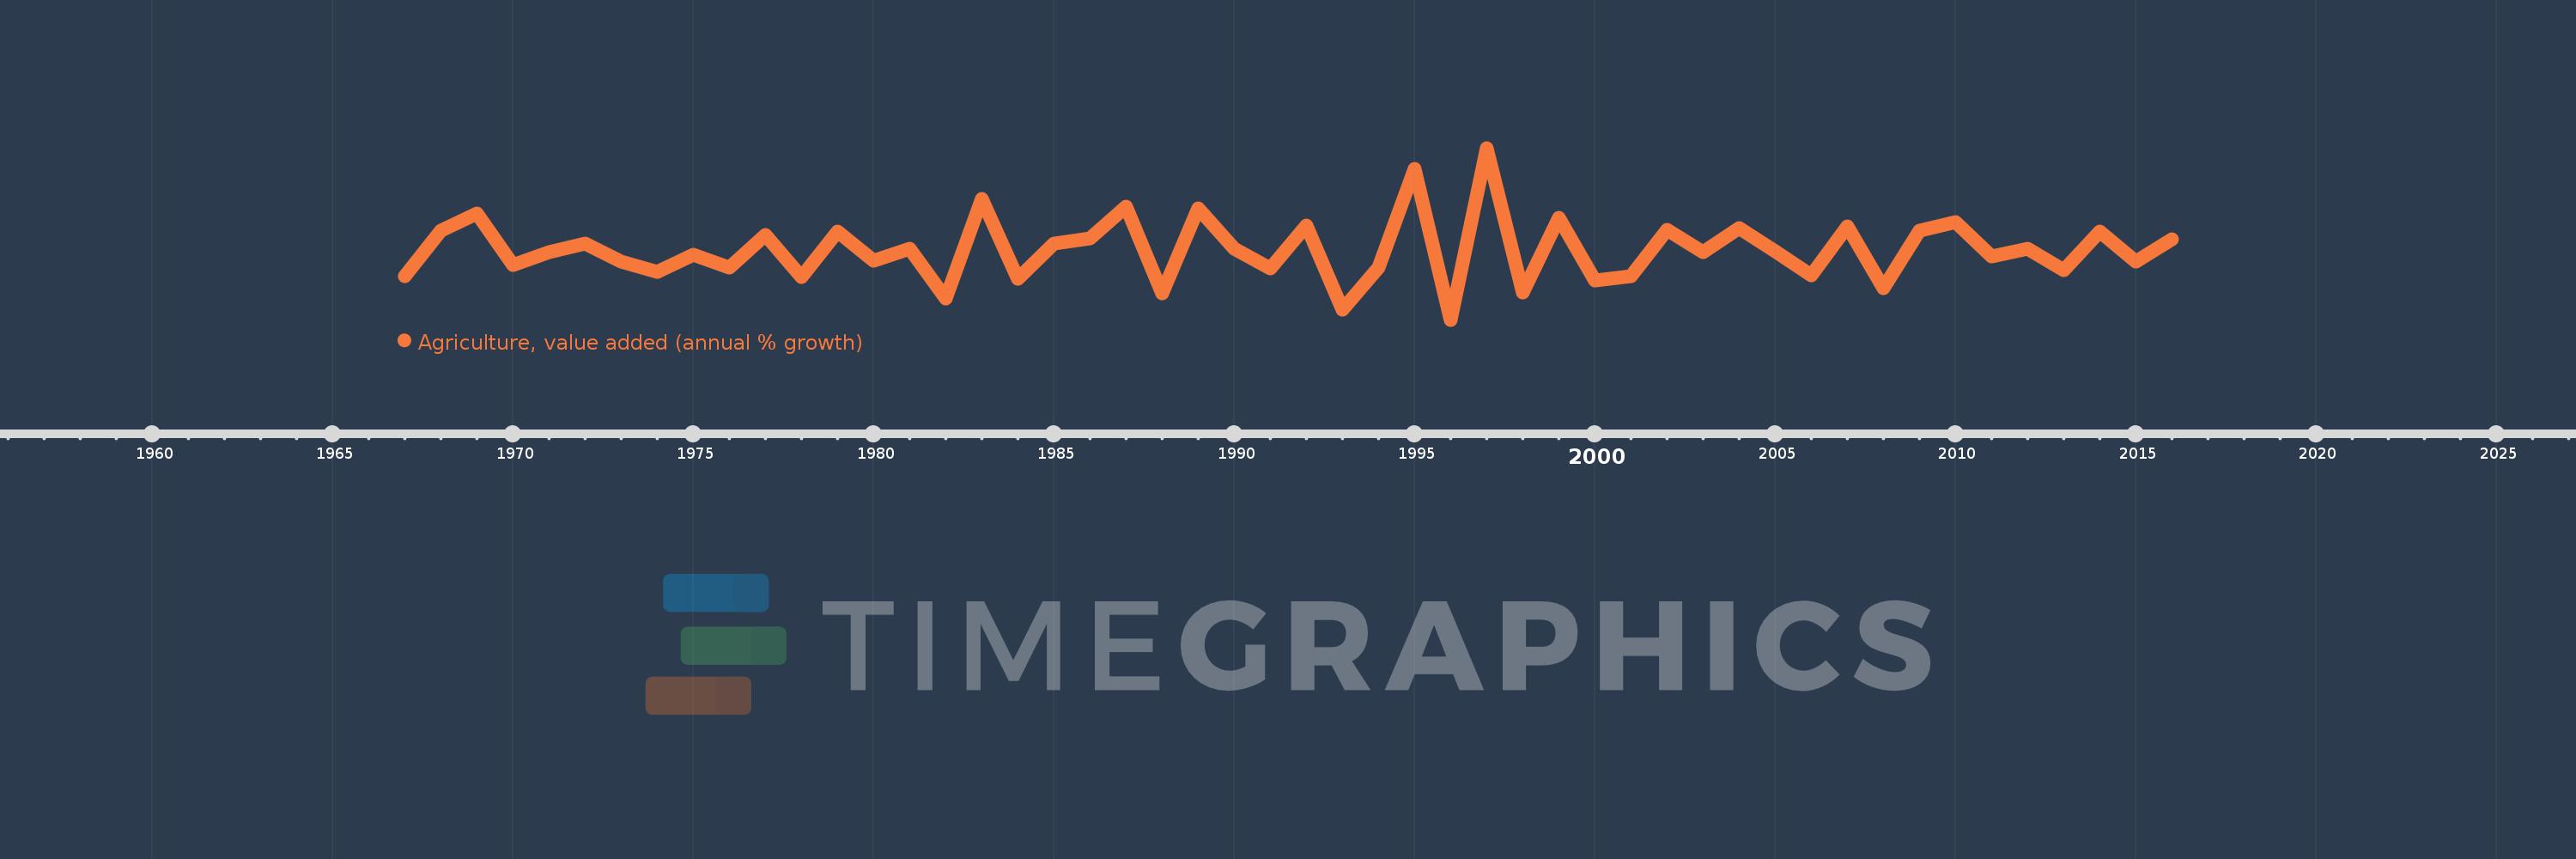
Agriculture, value added (annual % growth)
2016,2015,2014,2013,2012,2011,2010,2009,2008,2007,2006,2005,2004,2003,2002,2001,2000,1999,1998,1997,1996,1995,1994,1993,1992,1991,1990,1989,1988,1987,1986,1985,1984,1983,1982,1981,1980,1979,1978,1977,1976,1975,1974,1973,1972,1971,1970,1969,1968,1967
This statistics in other country:
AfghanistanAlbaniaAlgeriaAntigua and BarbudaArab WorldArgentinaArmeniaAustraliaAustriaAzerbaijanBahamas, TheBahrainBangladeshBelarusBelgiumBelizeBeninBermudaBhutanBoliviaBosnia and HerzegovinaBotswanaBrazilBrunei DarussalamBulgariaBurkina FasoBurundiCabo VerdeCambodiaCameroonCanadaCaribbean small statesCayman IslandsCentral African RepublicCentral Europe and the BalticsChadChileChinaColombiaComorosCongo, Dem. Rep.Congo, Rep.Costa RicaCote d'IvoireCroatiaCubaCyprusCzech RepublicDenmarkDjiboutiDominicaDominican RepublicEarly-demographic dividendEast Asia & PacificEast Asia & Pacific (excluding high income)East Asia & Pacific (IDA & IBRD countries)EcuadorEgypt, Arab Rep.El SalvadorEquatorial GuineaEritreaEstoniaEthiopiaEuro areaEurope & Central AsiaEurope & Central Asia (excluding high income)Europe & Central Asia (IDA & IBRD countries)European UnionFijiFinlandFragile and conflict affected situationsFranceGabonGambia, TheGeorgiaGermanyGhanaGreeceGrenadaGuatemalaGuineaGuinea-BissauGuyanaHaitiHeavily indebted poor countries (HIPC)High incomeHondurasHong Kong SAR, ChinaHungaryIBRD onlyIcelandIDA & IBRD totalIDA blendIDA onlyIDA totalIndiaIndonesiaIran, Islamic Rep.IraqIrelandItalyJamaicaJapanJordanKazakhstanKenyaKiribatiKorea, Rep.KosovoKuwaitKyrgyz RepublicLao PDRLate-demographic dividendLatin America & Caribbean Latin America & Caribbean (excluding high income)Latin America & the Caribbean (IDA & IBRD countries)LatviaLeast developed countries: UN classificationLebanonLesothoLiberiaLithuaniaLow & middle incomeLow incomeLower middle incomeLuxembourgMacedonia, FYRMadagascarMalawiMalaysiaMaldivesMaliMarshall IslandsMauritaniaMauritiusMexicoMicronesia, Fed. Sts.Middle East & North AfricaMiddle East & North Africa (excluding high income)Middle East & North Africa (IDA & IBRD countries)Middle incomeMoldovaMongoliaMontenegroMoroccoMozambiqueMyanmarNamibiaNepalNetherlandsNew ZealandNicaraguaNigerNigeriaNorth AmericaNorwayOECD membersOmanOther small statesPakistanPalauPanamaPapua New GuineaParaguayPeruPhilippinesPolandPortugalPost-demographic dividendPre-demographic dividendPuerto RicoQatarRomaniaRussian FederationRwandaSamoaSao Tome and PrincipeSaudi ArabiaSenegalSerbiaSeychellesSierra LeoneSingaporeSlovak RepublicSloveniaSmall statesSolomon IslandsSomaliaSouth AfricaSouth AsiaSouth Asia (IDA & IBRD)SpainSri LankaSt. Kitts and NevisSt. LuciaSt. Vincent and the GrenadinesSub-Saharan Africa Sub-Saharan Africa (excluding high income)Sub-Saharan Africa (IDA & IBRD countries)SudanSurinameSwazilandSwedenSwitzerlandSyrian Arab RepublicTajikistanTanzaniaThailandTimor-LesteTogoTongaTrinidad and TobagoTunisiaTurkeyTurkmenistanTuvaluUgandaUkraineUnited Arab EmiratesUnited KingdomUnited StatesUpper middle incomeUruguayUzbekistanVanuatuVenezuela, RBVietnamWest Bank and GazaWorldZambiaZimbabwe Timeline:
This timeline shows a graph from 1967 to 2016 of Morocco. No data until 1966. Number of actual observations by date: 50.
Source name:
World Development Indicators
Source organization:
World Bank national accounts data, and OECD National Accounts data files.
Categories, topics:
Economy & Growth
Last updated:
apr 23, 2017
Indicators value changes by year
Minimum:
-41.008
jan 1, 1996
Maximum:
73.583
jan 1, 1997
At the date of observation
Value
Absolute change
Change from previous value
jan 1, 1967
-11.717
-11.717
0.0%
jan 1, 1968
18.622
+30.339
-258.93%
jan 1, 1969
29.594
+10.972
58.92%
jan 1, 1970
-4.262
-33.855
-114.4%
jan 1, 1971
4.171
+8.433
-197.88%
jan 1, 1972
9.997
+5.826
139.67%
jan 1, 1973
-2.223
-12.221
-122.24%
jan 1, 1974
-9.32
-7.097
319.21%
jan 1, 1975
2.094
+11.415
-122.47%
jan 1, 1976
-6.343
-8.437
-402.87%
jan 1, 1977
15.303
+21.645
-341.26%
jan 1, 1978
-12.322
-27.625
-180.52%
jan 1, 1979
17.959
+30.281
-245.75%
jan 1, 1980
-1.716
-19.675
-109.55%
jan 1, 1981
6.147
+7.863
-458.26%
jan 1, 1982
-26.794
-32.941
-535.89%
jan 1, 1983
39.472
+66.266
-247.31%
jan 1, 1984
-13.407
-52.878
-133.97%
jan 1, 1985
9.837
+23.244
-173.37%
jan 1, 1986
13.428
+3.591
36.51%
jan 1, 1987
34.199
+20.771
154.68%
jan 1, 1988
-23.533
-57.732
-168.81%
jan 1, 1989
33.427
+56.96
-242.04%
jan 1, 1990
6.366
-27.06
-80.95%
jan 1, 1991
-6.664
-13.031
-204.68%
jan 1, 1992
21.75
+28.414
-426.37%
jan 1, 1993
-34.237
-55.987
-257.41%
jan 1, 1994
-6.323
+27.914
-81.53%
jan 1, 1995
59.756
+66.079
-1.05K%
jan 1, 1996
-41.008
-100.764
-168.63%
jan 1, 1997
73.583
+114.591
-279.43%
jan 1, 1998
-22.888
-96.471
-131.11%
jan 1, 1999
26.819
+49.707
-217.17%
jan 1, 2000
-14.68
-41.499
-154.74%
jan 1, 2001
-12.161
+2.519
-17.16%
jan 1, 2002
19.062
+31.223
-256.74%
jan 1, 2003
4.279
-14.783
-77.55%
jan 1, 2004
20.306
+16.027
374.55%
jan 1, 2005
4.466
-15.84
-78.01%
jan 1, 2006
-11.102
-15.568
-348.58%
jan 1, 2007
21.067
+32.169
-289.76%
jan 1, 2008
-20.021
-41.088
-195.04%
jan 1, 2009
18.622
+38.643
-193.01%
jan 1, 2010
23.946
+5.324
28.59%
jan 1, 2011
1.106
-22.84
-95.38%
jan 1, 2012
6.66
+5.554
501.96%
jan 1, 2013
-7.837
-14.497
-217.67%
jan 1, 2014
17.823
+25.66
-327.43%
jan 1, 2015
-2.314
-20.138
-112.99%
jan 1, 2016
12.958
+15.272
-659.87%
Ranking of countries by current statistics by years


Comments: