29
/
en
AIzaSyAYiBZKx7MnpbEhh9jyipgxe19OcubqV5w
April 1, 2024
108241
Comoros
COM
true
2
1
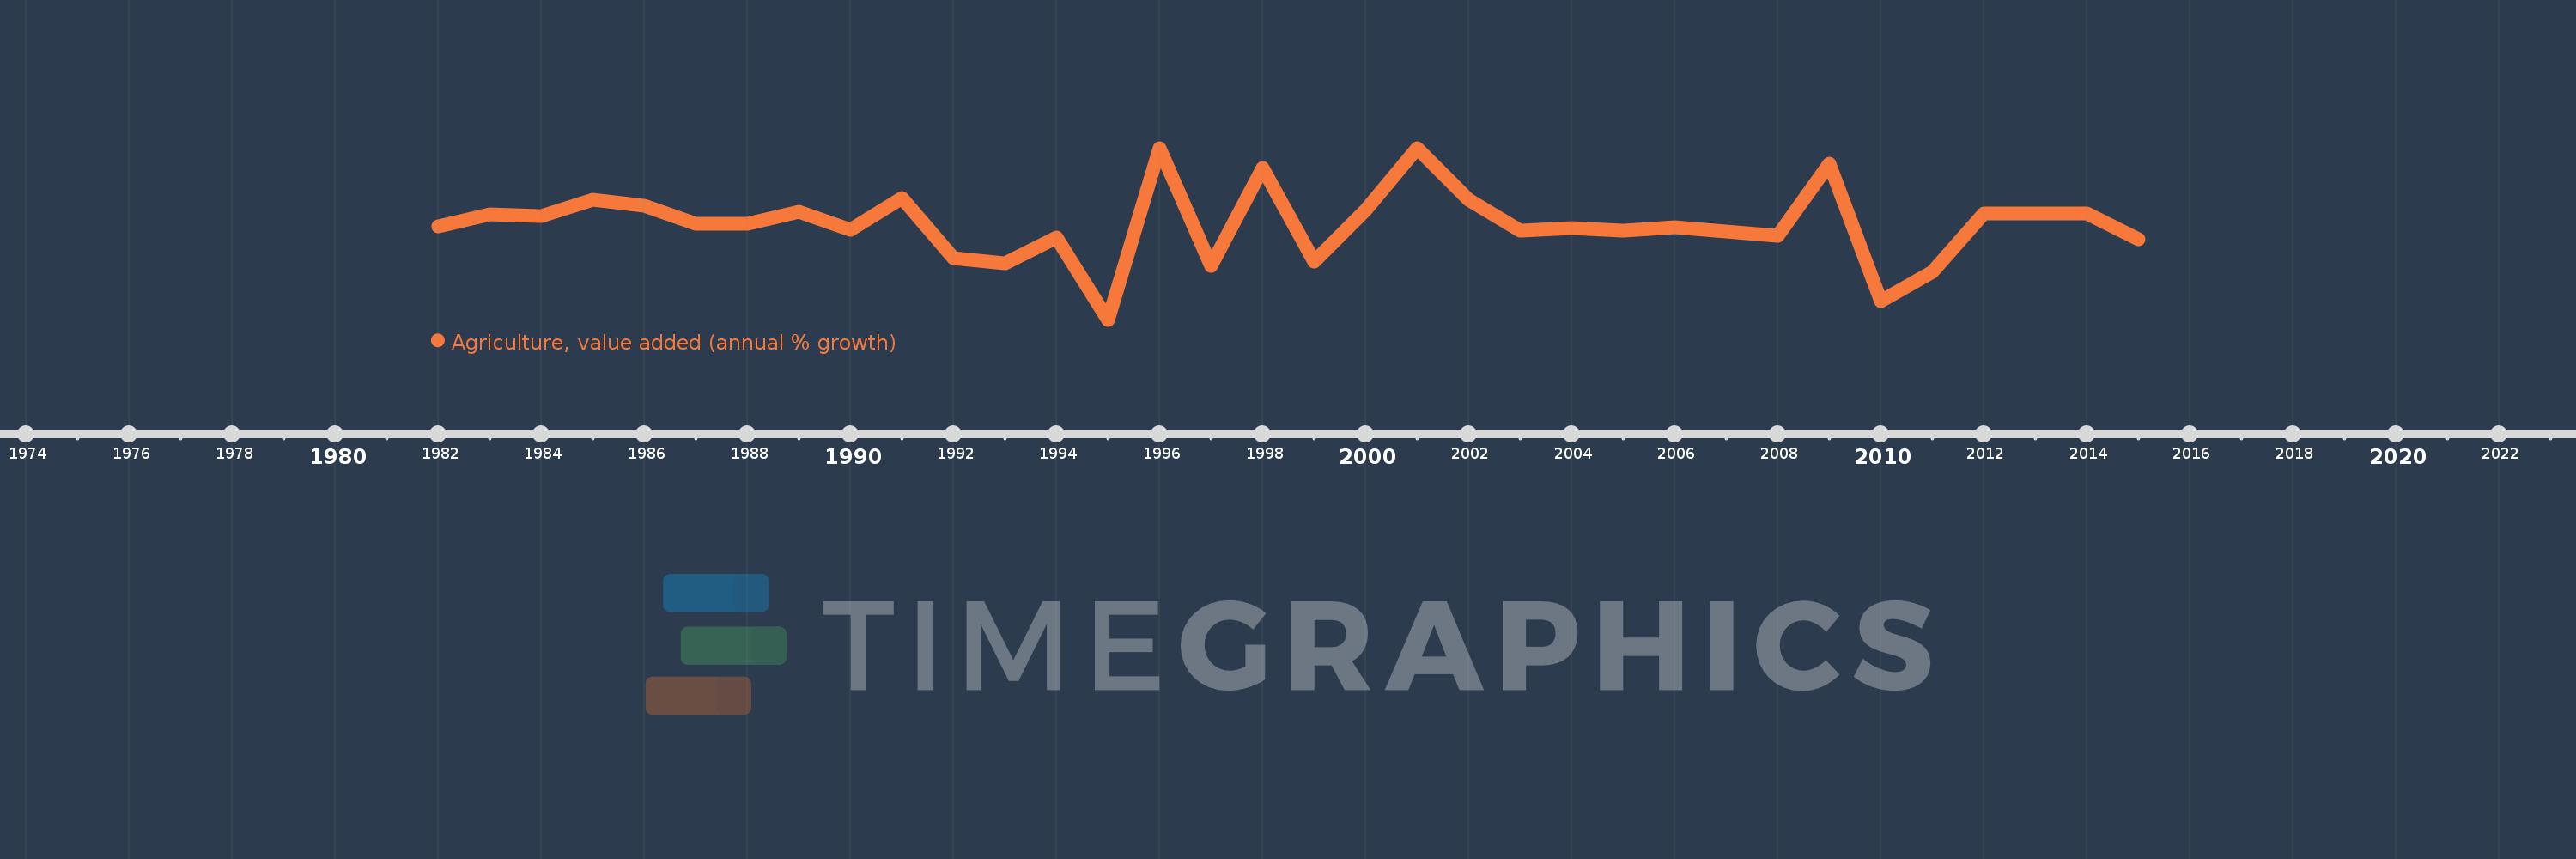
Agriculture, value added (annual % growth)
2015,2014,2013,2012,2011,2010,2009,2008,2007,2006,2005,2004,2003,2002,2001,2000,1999,1998,1997,1996,1995,1994,1993,1992,1991,1990,1989,1988,1987,1986,1985,1984,1983,1982
This statistics in other country:
AfghanistanAlbaniaAlgeriaAntigua and BarbudaArab WorldArgentinaArmeniaAustraliaAustriaAzerbaijanBahamas, TheBahrainBangladeshBelarusBelgiumBelizeBeninBermudaBhutanBoliviaBosnia and HerzegovinaBotswanaBrazilBrunei DarussalamBulgariaBurkina FasoBurundiCabo VerdeCambodiaCameroonCanadaCaribbean small statesCayman IslandsCentral African RepublicCentral Europe and the BalticsChadChileChinaColombiaComorosCongo, Dem. Rep.Congo, Rep.Costa RicaCote d'IvoireCroatiaCubaCyprusCzech RepublicDenmarkDjiboutiDominicaDominican RepublicEarly-demographic dividendEast Asia & PacificEast Asia & Pacific (excluding high income)East Asia & Pacific (IDA & IBRD countries)EcuadorEgypt, Arab Rep.El SalvadorEquatorial GuineaEritreaEstoniaEthiopiaEuro areaEurope & Central AsiaEurope & Central Asia (excluding high income)Europe & Central Asia (IDA & IBRD countries)European UnionFijiFinlandFragile and conflict affected situationsFranceGabonGambia, TheGeorgiaGermanyGhanaGreeceGrenadaGuatemalaGuineaGuinea-BissauGuyanaHaitiHeavily indebted poor countries (HIPC)High incomeHondurasHong Kong SAR, ChinaHungaryIBRD onlyIcelandIDA & IBRD totalIDA blendIDA onlyIDA totalIndiaIndonesiaIran, Islamic Rep.IraqIrelandItalyJamaicaJapanJordanKazakhstanKenyaKiribatiKorea, Rep.KosovoKuwaitKyrgyz RepublicLao PDRLate-demographic dividendLatin America & Caribbean Latin America & Caribbean (excluding high income)Latin America & the Caribbean (IDA & IBRD countries)LatviaLeast developed countries: UN classificationLebanonLesothoLiberiaLithuaniaLow & middle incomeLow incomeLower middle incomeLuxembourgMacedonia, FYRMadagascarMalawiMalaysiaMaldivesMaliMarshall IslandsMauritaniaMauritiusMexicoMicronesia, Fed. Sts.Middle East & North AfricaMiddle East & North Africa (excluding high income)Middle East & North Africa (IDA & IBRD countries)Middle incomeMoldovaMongoliaMontenegroMoroccoMozambiqueMyanmarNamibiaNepalNetherlandsNew ZealandNicaraguaNigerNigeriaNorth AmericaNorwayOECD membersOmanOther small statesPakistanPalauPanamaPapua New GuineaParaguayPeruPhilippinesPolandPortugalPost-demographic dividendPre-demographic dividendPuerto RicoQatarRomaniaRussian FederationRwandaSamoaSao Tome and PrincipeSaudi ArabiaSenegalSerbiaSeychellesSierra LeoneSingaporeSlovak RepublicSloveniaSmall statesSolomon IslandsSomaliaSouth AfricaSouth AsiaSouth Asia (IDA & IBRD)SpainSri LankaSt. Kitts and NevisSt. LuciaSt. Vincent and the GrenadinesSub-Saharan Africa Sub-Saharan Africa (excluding high income)Sub-Saharan Africa (IDA & IBRD countries)SudanSurinameSwazilandSwedenSwitzerlandSyrian Arab RepublicTajikistanTanzaniaThailandTimor-LesteTogoTongaTrinidad and TobagoTunisiaTurkeyTurkmenistanTuvaluUgandaUkraineUnited Arab EmiratesUnited KingdomUnited StatesUpper middle incomeUruguayUzbekistanVanuatuVenezuela, RBVietnamWest Bank and GazaWorldZambiaZimbabwe Timeline:
This timeline shows a graph from 1982 to 2015 of Comoros. No data until 1981. Number of actual observations by date: 34.
Source name:
World Development Indicators
Source organization:
World Bank national accounts data, and OECD National Accounts data files.
Categories, topics:
Economy & Growth
Last updated:
apr 23, 2017
Indicators value changes by year
Minimum:
-4.724
jan 1, 1995
At the date of observation
Value
Absolute change
Change from previous value
jan 1, 1982
3.092
+3.092
0.0%
jan 1, 1983
4.056
+0.963
31.15%
jan 1, 1984
3.952
-0.104
-2.57%
jan 1, 1985
5.292
+1.34
33.91%
jan 1, 1986
4.815
-0.476
-9.0%
jan 1, 1987
3.274
-1.542
-32.02%
jan 1, 1988
3.302
+0.029
0.88%
jan 1, 1989
4.27
+0.968
29.31%
jan 1, 1990
2.774
-1.496
-35.04%
jan 1, 1991
5.401
+2.628
94.74%
jan 1, 1992
0.404
-4.997
-92.52%
jan 1, 1993
0.004
-0.401
-99.13%
jan 1, 1994
2.14
+2.137
60.5K%
jan 1, 1995
-4.724
-6.864
-320.69%
jan 1, 1996
9.6
+14.324
-303.23%
jan 1, 1997
-0.2
-9.8
-102.08%
jan 1, 1998
7.9
+8.1
-4.05K%
jan 1, 1999
0.1
-7.8
-98.73%
jan 1, 2000
4.4
+4.3
4.3K%
jan 1, 2001
9.583
+5.183
117.8%
jan 1, 2002
5.304
-4.279
-44.65%
jan 1, 2003
2.711
-2.594
-48.9%
jan 1, 2004
2.909
+0.199
7.34%
jan 1, 2005
2.701
-0.209
-7.17%
jan 1, 2006
3.0
+0.299
11.08%
jan 1, 2007
2.611
-0.388
-12.95%
jan 1, 2008
2.304
-0.307
-11.76%
jan 1, 2009
8.317
+6.013
260.94%
jan 1, 2010
-3.139
-11.457
-137.74%
jan 1, 2011
-0.706
+2.433
-77.5%
jan 1, 2012
4.1
+4.806
-680.61%
jan 1, 2015
2.0
-2.1
-51.22%
Ranking of countries by current statistics by years


Comments: