29
/
en
AIzaSyAYiBZKx7MnpbEhh9jyipgxe19OcubqV5w
April 1, 2024
36358
IBRD only
IBD
false
2
1
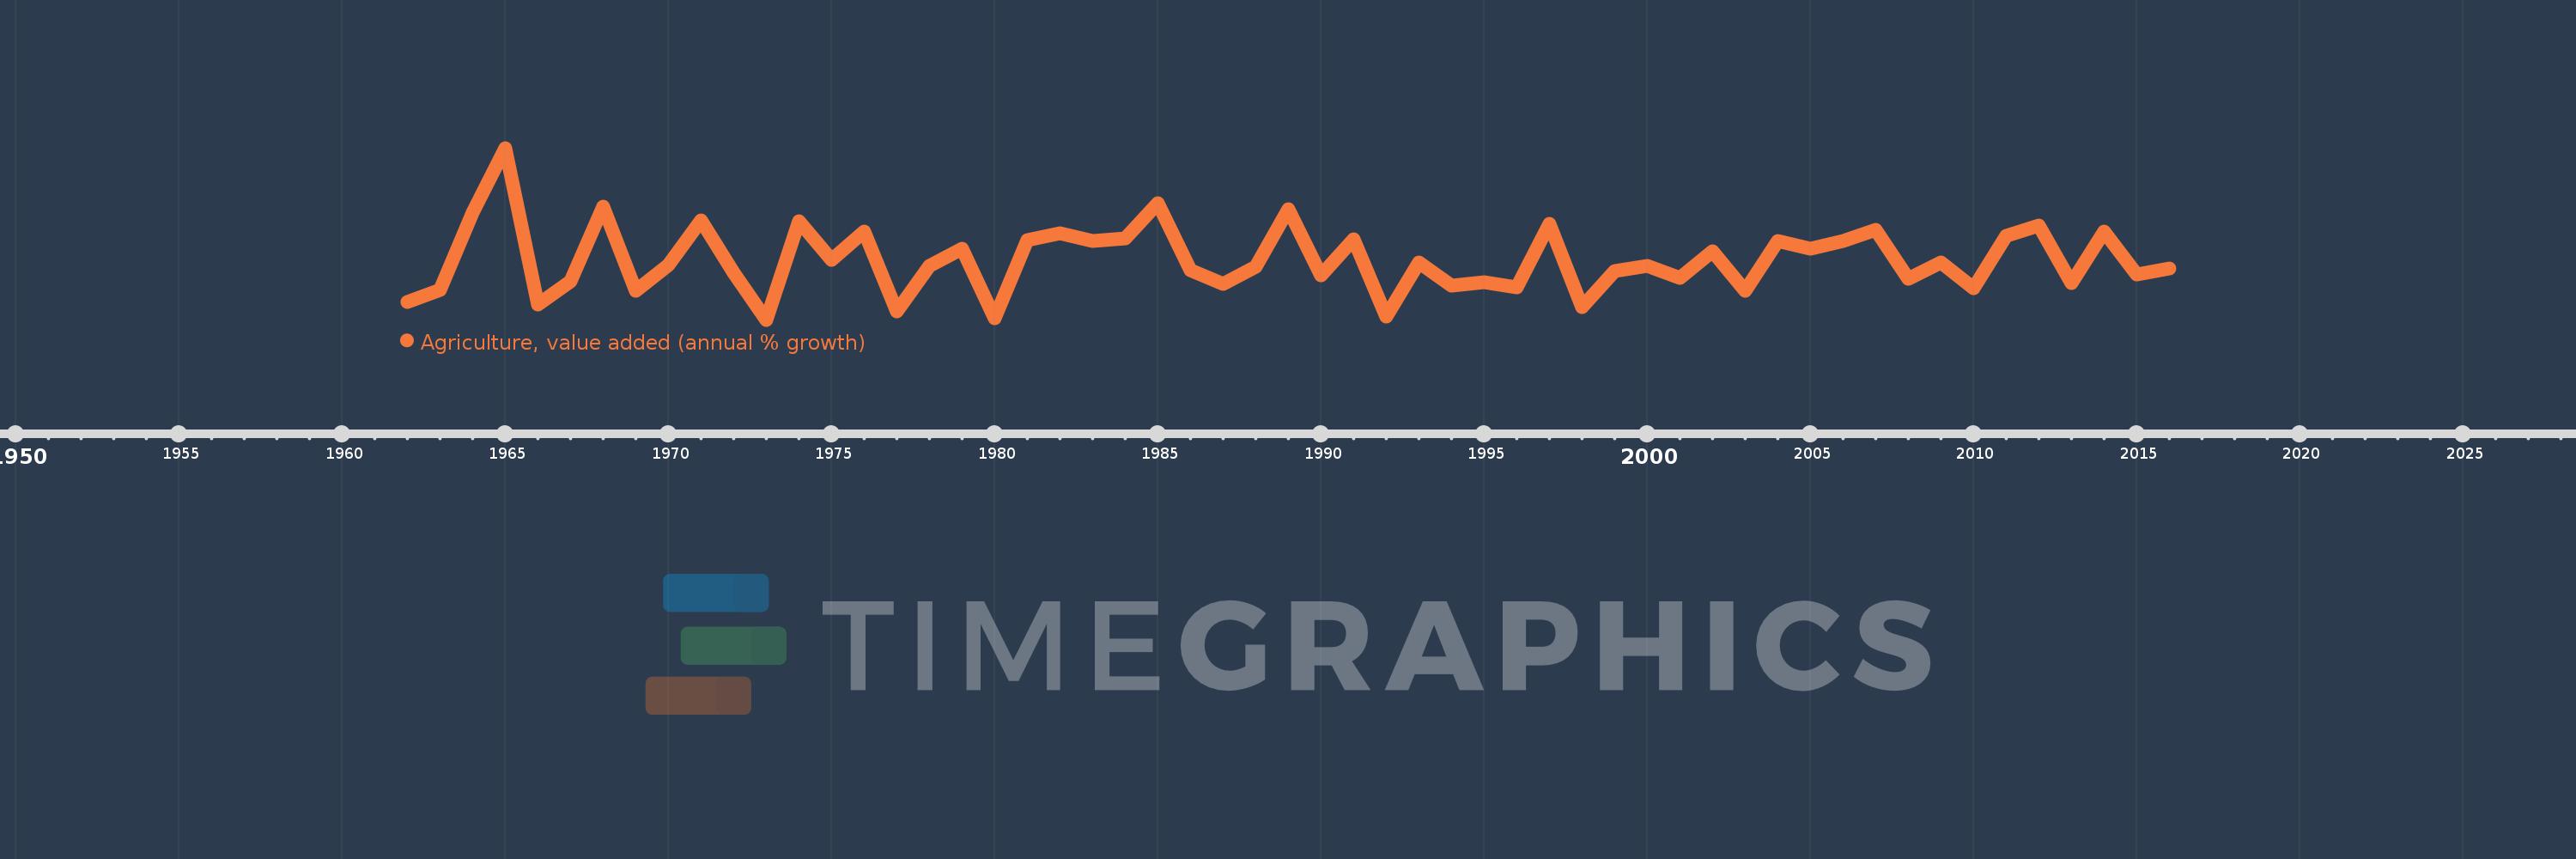
Agriculture, value added (annual % growth)
2016,2015,2014,2013,2012,2011,2010,2009,2008,2007,2006,2005,2004,2003,2002,2001,2000,1999,1998,1997,1996,1995,1994,1993,1992,1991,1990,1989,1988,1987,1986,1985,1984,1983,1982,1981,1980,1979,1978,1977,1976,1975,1974,1973,1972,1971,1970,1969,1968,1967,1966,1965,1964,1963,1962
This statistics in other country:
AfghanistanAlbaniaAlgeriaAntigua and BarbudaArab WorldArgentinaArmeniaAustraliaAustriaAzerbaijanBahamas, TheBahrainBangladeshBelarusBelgiumBelizeBeninBermudaBhutanBoliviaBosnia and HerzegovinaBotswanaBrazilBrunei DarussalamBulgariaBurkina FasoBurundiCabo VerdeCambodiaCameroonCanadaCaribbean small statesCayman IslandsCentral African RepublicCentral Europe and the BalticsChadChileChinaColombiaComorosCongo, Dem. Rep.Congo, Rep.Costa RicaCote d'IvoireCroatiaCubaCyprusCzech RepublicDenmarkDjiboutiDominicaDominican RepublicEarly-demographic dividendEast Asia & PacificEast Asia & Pacific (excluding high income)East Asia & Pacific (IDA & IBRD countries)EcuadorEgypt, Arab Rep.El SalvadorEquatorial GuineaEritreaEstoniaEthiopiaEuro areaEurope & Central AsiaEurope & Central Asia (excluding high income)Europe & Central Asia (IDA & IBRD countries)European UnionFijiFinlandFragile and conflict affected situationsFranceGabonGambia, TheGeorgiaGermanyGhanaGreeceGrenadaGuatemalaGuineaGuinea-BissauGuyanaHaitiHeavily indebted poor countries (HIPC)High incomeHondurasHong Kong SAR, ChinaHungaryIBRD onlyIcelandIDA & IBRD totalIDA blendIDA onlyIDA totalIndiaIndonesiaIran, Islamic Rep.IraqIrelandItalyJamaicaJapanJordanKazakhstanKenyaKiribatiKorea, Rep.KosovoKuwaitKyrgyz RepublicLao PDRLate-demographic dividendLatin America & Caribbean Latin America & Caribbean (excluding high income)Latin America & the Caribbean (IDA & IBRD countries)LatviaLeast developed countries: UN classificationLebanonLesothoLiberiaLithuaniaLow & middle incomeLow incomeLower middle incomeLuxembourgMacedonia, FYRMadagascarMalawiMalaysiaMaldivesMaliMarshall IslandsMauritaniaMauritiusMexicoMicronesia, Fed. Sts.Middle East & North AfricaMiddle East & North Africa (excluding high income)Middle East & North Africa (IDA & IBRD countries)Middle incomeMoldovaMongoliaMontenegroMoroccoMozambiqueMyanmarNamibiaNepalNetherlandsNew ZealandNicaraguaNigerNigeriaNorth AmericaNorwayOECD membersOmanOther small statesPakistanPalauPanamaPapua New GuineaParaguayPeruPhilippinesPolandPortugalPost-demographic dividendPre-demographic dividendPuerto RicoQatarRomaniaRussian FederationRwandaSamoaSao Tome and PrincipeSaudi ArabiaSenegalSerbiaSeychellesSierra LeoneSingaporeSlovak RepublicSloveniaSmall statesSolomon IslandsSomaliaSouth AfricaSouth AsiaSouth Asia (IDA & IBRD)SpainSri LankaSt. Kitts and NevisSt. LuciaSt. Vincent and the GrenadinesSub-Saharan Africa Sub-Saharan Africa (excluding high income)Sub-Saharan Africa (IDA & IBRD countries)SudanSurinameSwazilandSwedenSwitzerlandSyrian Arab RepublicTajikistanTanzaniaThailandTimor-LesteTogoTongaTrinidad and TobagoTunisiaTurkeyTurkmenistanTuvaluUgandaUkraineUnited Arab EmiratesUnited KingdomUnited StatesUpper middle incomeUruguayUzbekistanVanuatuVenezuela, RBVietnamWest Bank and GazaWorldZambiaZimbabwe Timeline:
This timeline shows a graph from 1962 to 2016 of IBRD only. No data until 1961. Number of actual observations by date: 55.
Source name:
World Development Indicators
Source organization:
World Bank national accounts data, and OECD National Accounts data files.
Categories, topics:
Economy & Growth
Last updated:
apr 23, 2017
Indicators value changes by year
At the date of observation
Value
Absolute change
Change from previous value
jan 1, 1962
0.965
+0.965
0.0%
jan 1, 1963
1.549
+0.584
60.59%
jan 1, 1964
5.49
+3.941
254.45%
jan 1, 1965
8.794
+3.303
60.17%
jan 1, 1966
0.806
-7.987
-90.83%
jan 1, 1967
2.018
+1.211
150.17%
jan 1, 1968
5.826
+3.809
188.77%
jan 1, 1969
1.535
-4.291
-73.65%
jan 1, 1970
2.848
+1.313
85.5%
jan 1, 1971
5.128
+2.281
80.09%
jan 1, 1972
2.445
-2.684
-52.33%
jan 1, 1973
0.047
-2.397
-98.06%
jan 1, 1974
5.05
+5.003
10.57K%
jan 1, 1975
3.082
-1.968
-38.97%
jan 1, 1976
4.542
+1.46
47.36%
jan 1, 1977
0.492
-4.05
-89.17%
jan 1, 1978
2.785
+2.293
466.21%
jan 1, 1979
3.664
+0.879
31.58%
jan 1, 1980
0.129
-3.534
-96.47%
jan 1, 1981
4.089
+3.959
3.06K%
jan 1, 1982
4.463
+0.375
9.17%
jan 1, 1983
4.076
-0.388
-8.69%
jan 1, 1984
4.203
+0.127
3.13%
jan 1, 1985
5.983
+1.78
42.35%
jan 1, 1986
2.553
-3.43
-57.33%
jan 1, 1987
1.872
-0.682
-26.7%
jan 1, 1988
2.743
+0.871
46.54%
jan 1, 1989
5.661
+2.919
106.42%
jan 1, 1990
2.293
-3.368
-59.49%
jan 1, 1991
4.15
+1.857
80.97%
jan 1, 1992
0.22
-3.93
-94.7%
jan 1, 1993
2.943
+2.723
1.24K%
jan 1, 1994
1.788
-1.155
-39.26%
jan 1, 1995
1.98
+0.192
10.74%
jan 1, 1996
1.698
-0.282
-14.25%
jan 1, 1997
4.919
+3.221
189.71%
jan 1, 1998
0.681
-4.237
-86.15%
jan 1, 1999
2.53
+1.849
271.39%
jan 1, 2000
2.795
+0.265
10.48%
jan 1, 2001
2.165
-0.631
-22.56%
jan 1, 2002
3.55
+1.385
63.99%
jan 1, 2003
1.5
-2.049
-57.73%
jan 1, 2004
4.051
+2.551
170.02%
jan 1, 2005
3.669
-0.383
-9.44%
jan 1, 2006
4.041
+0.373
10.15%
jan 1, 2007
4.636
+0.594
14.7%
jan 1, 2008
2.146
-2.49
-53.71%
jan 1, 2009
2.965
+0.819
38.18%
jan 1, 2010
1.662
-1.303
-43.95%
jan 1, 2011
4.325
+2.663
160.22%
jan 1, 2012
4.835
+0.51
11.8%
jan 1, 2013
1.919
-2.917
-60.32%
jan 1, 2014
4.523
+2.605
135.76%
jan 1, 2015
2.331
-2.192
-48.46%
jan 1, 2016
2.66
+0.328
14.09%
Ranking of countries by current statistics by years


Comments: