29
/
en
AIzaSyAYiBZKx7MnpbEhh9jyipgxe19OcubqV5w
April 1, 2024
252686
Sudan
SDN
true
2
1
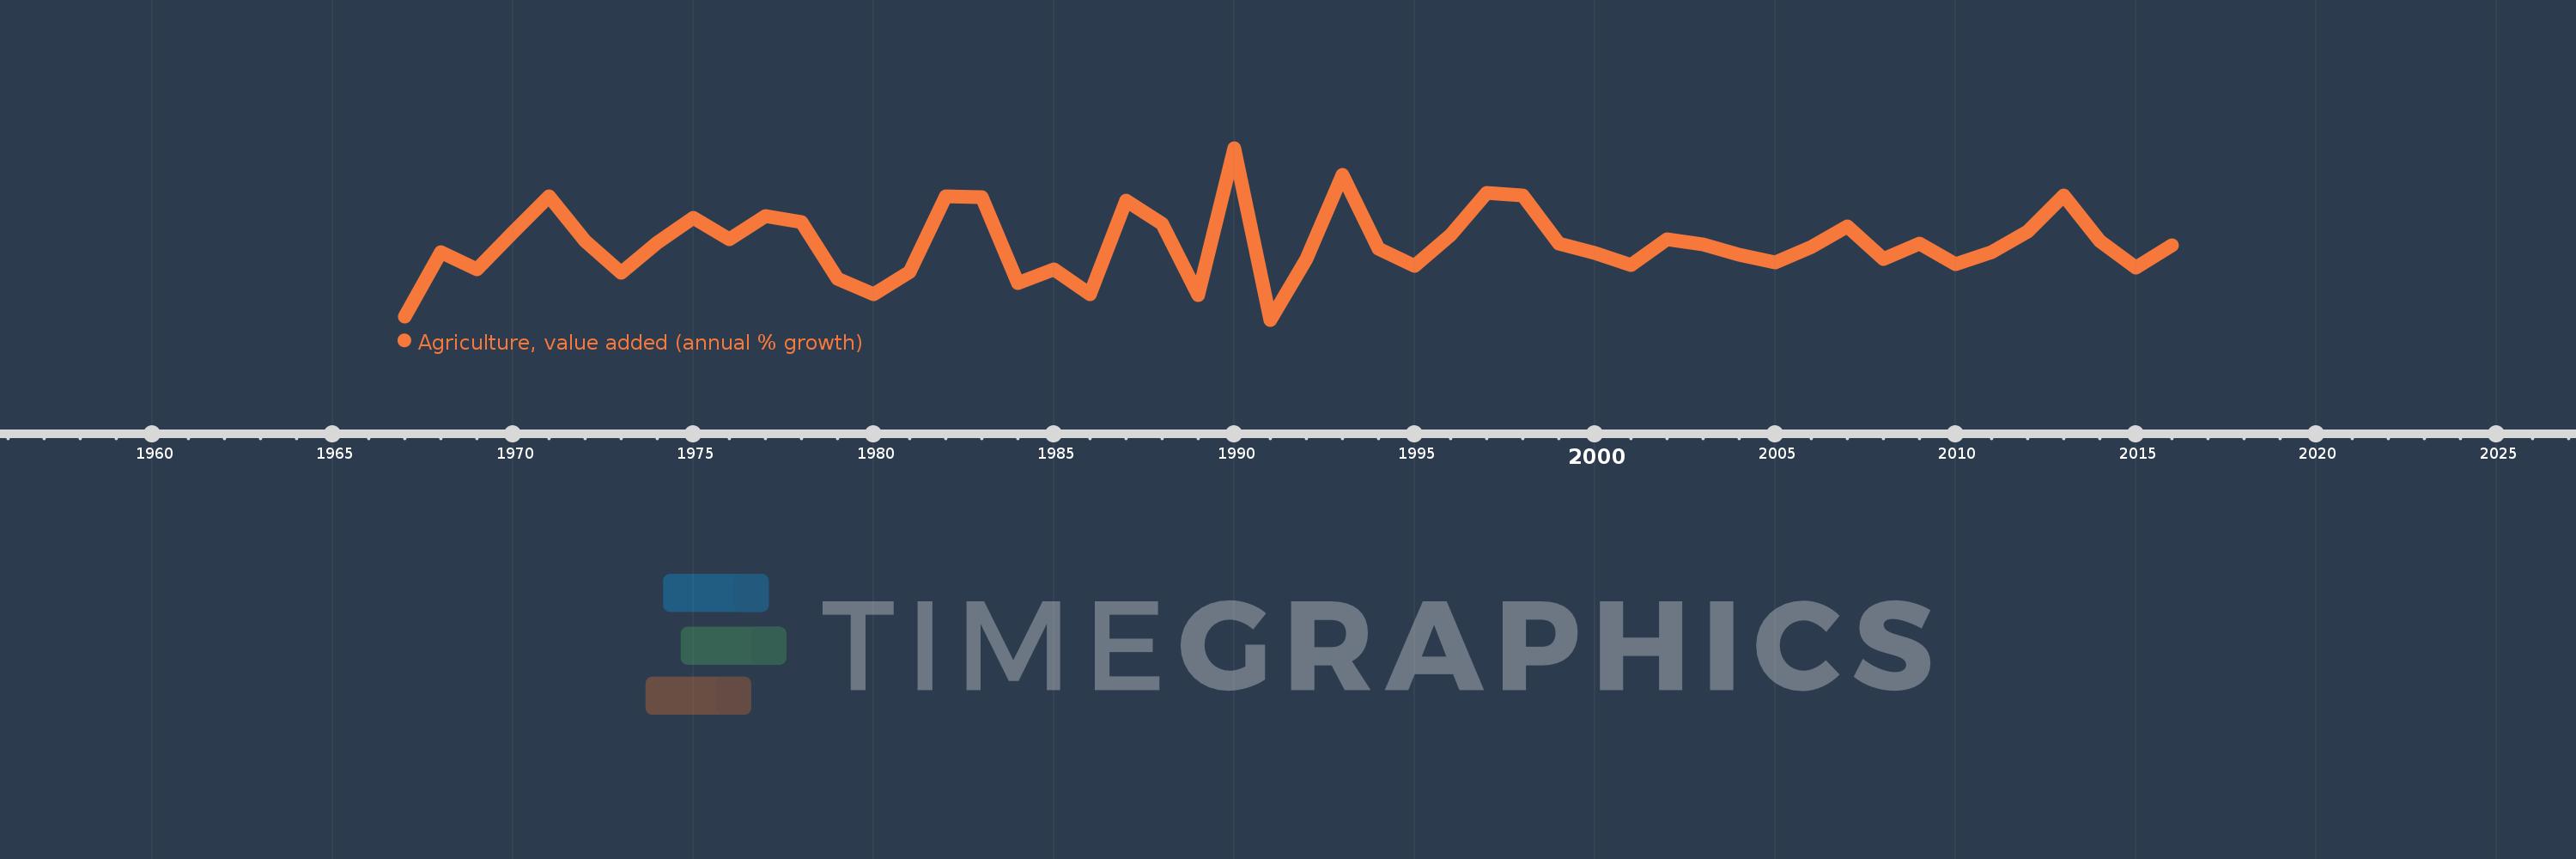
Agriculture, value added (annual % growth)
2016,2015,2014,2013,2012,2011,2010,2009,2008,2007,2006,2005,2004,2003,2002,2001,2000,1999,1998,1997,1996,1995,1994,1993,1992,1991,1990,1989,1988,1987,1986,1985,1984,1983,1982,1981,1980,1979,1978,1977,1976,1975,1974,1973,1972,1971,1970,1969,1968,1967
This statistics in other country:
AfghanistanAlbaniaAlgeriaAntigua and BarbudaArab WorldArgentinaArmeniaAustraliaAustriaAzerbaijanBahamas, TheBahrainBangladeshBelarusBelgiumBelizeBeninBermudaBhutanBoliviaBosnia and HerzegovinaBotswanaBrazilBrunei DarussalamBulgariaBurkina FasoBurundiCabo VerdeCambodiaCameroonCanadaCaribbean small statesCayman IslandsCentral African RepublicCentral Europe and the BalticsChadChileChinaColombiaComorosCongo, Dem. Rep.Congo, Rep.Costa RicaCote d'IvoireCroatiaCubaCyprusCzech RepublicDenmarkDjiboutiDominicaDominican RepublicEarly-demographic dividendEast Asia & PacificEast Asia & Pacific (excluding high income)East Asia & Pacific (IDA & IBRD countries)EcuadorEgypt, Arab Rep.El SalvadorEquatorial GuineaEritreaEstoniaEthiopiaEuro areaEurope & Central AsiaEurope & Central Asia (excluding high income)Europe & Central Asia (IDA & IBRD countries)European UnionFijiFinlandFragile and conflict affected situationsFranceGabonGambia, TheGeorgiaGermanyGhanaGreeceGrenadaGuatemalaGuineaGuinea-BissauGuyanaHaitiHeavily indebted poor countries (HIPC)High incomeHondurasHong Kong SAR, ChinaHungaryIBRD onlyIcelandIDA & IBRD totalIDA blendIDA onlyIDA totalIndiaIndonesiaIran, Islamic Rep.IraqIrelandItalyJamaicaJapanJordanKazakhstanKenyaKiribatiKorea, Rep.KosovoKuwaitKyrgyz RepublicLao PDRLate-demographic dividendLatin America & Caribbean Latin America & Caribbean (excluding high income)Latin America & the Caribbean (IDA & IBRD countries)LatviaLeast developed countries: UN classificationLebanonLesothoLiberiaLithuaniaLow & middle incomeLow incomeLower middle incomeLuxembourgMacedonia, FYRMadagascarMalawiMalaysiaMaldivesMaliMarshall IslandsMauritaniaMauritiusMexicoMicronesia, Fed. Sts.Middle East & North AfricaMiddle East & North Africa (excluding high income)Middle East & North Africa (IDA & IBRD countries)Middle incomeMoldovaMongoliaMontenegroMoroccoMozambiqueMyanmarNamibiaNepalNetherlandsNew ZealandNicaraguaNigerNigeriaNorth AmericaNorwayOECD membersOmanOther small statesPakistanPalauPanamaPapua New GuineaParaguayPeruPhilippinesPolandPortugalPost-demographic dividendPre-demographic dividendPuerto RicoQatarRomaniaRussian FederationRwandaSamoaSao Tome and PrincipeSaudi ArabiaSenegalSerbiaSeychellesSierra LeoneSingaporeSlovak RepublicSloveniaSmall statesSolomon IslandsSomaliaSouth AfricaSouth AsiaSouth Asia (IDA & IBRD)SpainSri LankaSt. Kitts and NevisSt. LuciaSt. Vincent and the GrenadinesSub-Saharan Africa Sub-Saharan Africa (excluding high income)Sub-Saharan Africa (IDA & IBRD countries)SudanSurinameSwazilandSwedenSwitzerlandSyrian Arab RepublicTajikistanTanzaniaThailandTimor-LesteTogoTongaTrinidad and TobagoTunisiaTurkeyTurkmenistanTuvaluUgandaUkraineUnited Arab EmiratesUnited KingdomUnited StatesUpper middle incomeUruguayUzbekistanVanuatuVenezuela, RBVietnamWest Bank and GazaWorldZambiaZimbabwe Timeline:
This timeline shows a graph from 1967 to 2016 of Sudan. No data until 1966. Number of actual observations by date: 50.
Source name:
World Development Indicators
Source organization:
World Bank national accounts data, and OECD National Accounts data files.
Categories, topics:
Economy & Growth
Last updated:
apr 23, 2017
Indicators value changes by year
Minimum:
-20.218
jan 1, 1991
Maximum:
32.838
jan 1, 1990
At the date of observation
Value
Absolute change
Change from previous value
jan 1, 1967
-19.356
-19.356
0.0%
jan 1, 1968
0.681
+20.037
-103.52%
jan 1, 1969
-4.751
-5.431
-797.91%
jan 1, 1970
6.747
+11.498
-242.02%
jan 1, 1971
17.879
+11.132
165.0%
jan 1, 1972
3.997
-13.883
-77.65%
jan 1, 1973
-5.666
-9.663
-241.78%
jan 1, 1974
3.533
+9.199
-162.34%
jan 1, 1975
11.365
+7.832
221.71%
jan 1, 1976
4.621
-6.744
-59.34%
jan 1, 1977
11.785
+7.164
155.03%
jan 1, 1978
9.896
-1.889
-16.03%
jan 1, 1979
-7.618
-17.514
-176.98%
jan 1, 1980
-12.232
-4.614
60.57%
jan 1, 1981
-5.501
+6.731
-55.03%
jan 1, 1982
17.994
+23.495
-427.11%
jan 1, 1983
17.519
-0.475
-2.64%
jan 1, 1984
-8.874
-26.393
-150.65%
jan 1, 1985
-4.63
+4.244
-47.82%
jan 1, 1986
-12.218
-7.588
163.88%
jan 1, 1987
16.48
+28.698
-234.88%
jan 1, 1988
9.536
-6.944
-42.14%
jan 1, 1989
-12.494
-22.029
-231.02%
jan 1, 1990
32.838
+45.331
-362.84%
jan 1, 1991
-20.218
-53.056
-161.57%
jan 1, 1992
-1.343
+18.876
-93.36%
jan 1, 1993
24.505
+25.848
-1.92K%
jan 1, 1994
1.647
-22.858
-93.28%
jan 1, 1995
-3.706
-5.353
-325.02%
jan 1, 1996
6.0
+9.706
-261.91%
jan 1, 1997
18.97
+12.97
216.17%
jan 1, 1998
18.247
-0.723
-3.81%
jan 1, 1999
3.298
-14.949
-81.93%
jan 1, 2000
0.334
-2.964
-89.89%
jan 1, 2001
-3.452
-3.786
-1.13K%
jan 1, 2002
4.613
+8.065
-233.65%
jan 1, 2003
2.973
-1.641
-35.57%
jan 1, 2004
-0.225
-3.198
-107.57%
jan 1, 2005
-2.501
-2.276
1.01K%
jan 1, 2006
2.237
+4.739
-189.45%
jan 1, 2007
8.683
+6.446
288.09%
jan 1, 2008
-1.377
-10.06
-115.86%
jan 1, 2009
3.348
+4.725
-343.09%
jan 1, 2010
-2.97
-6.318
-188.7%
jan 1, 2011
0.723
+3.693
-124.36%
jan 1, 2012
7.038
+6.314
872.81%
jan 1, 2013
18.151
+11.114
157.91%
jan 1, 2014
4.0
-14.151
-77.96%
jan 1, 2015
-4.114
-8.114
-202.85%
jan 1, 2016
2.784
+6.898
-167.68%
Ranking of countries by current statistics by years


Comments: