29
/
en
AIzaSyAYiBZKx7MnpbEhh9jyipgxe19OcubqV5w
April 1, 2024
109305
Congo, Dem. Rep.
COD
true
2
1
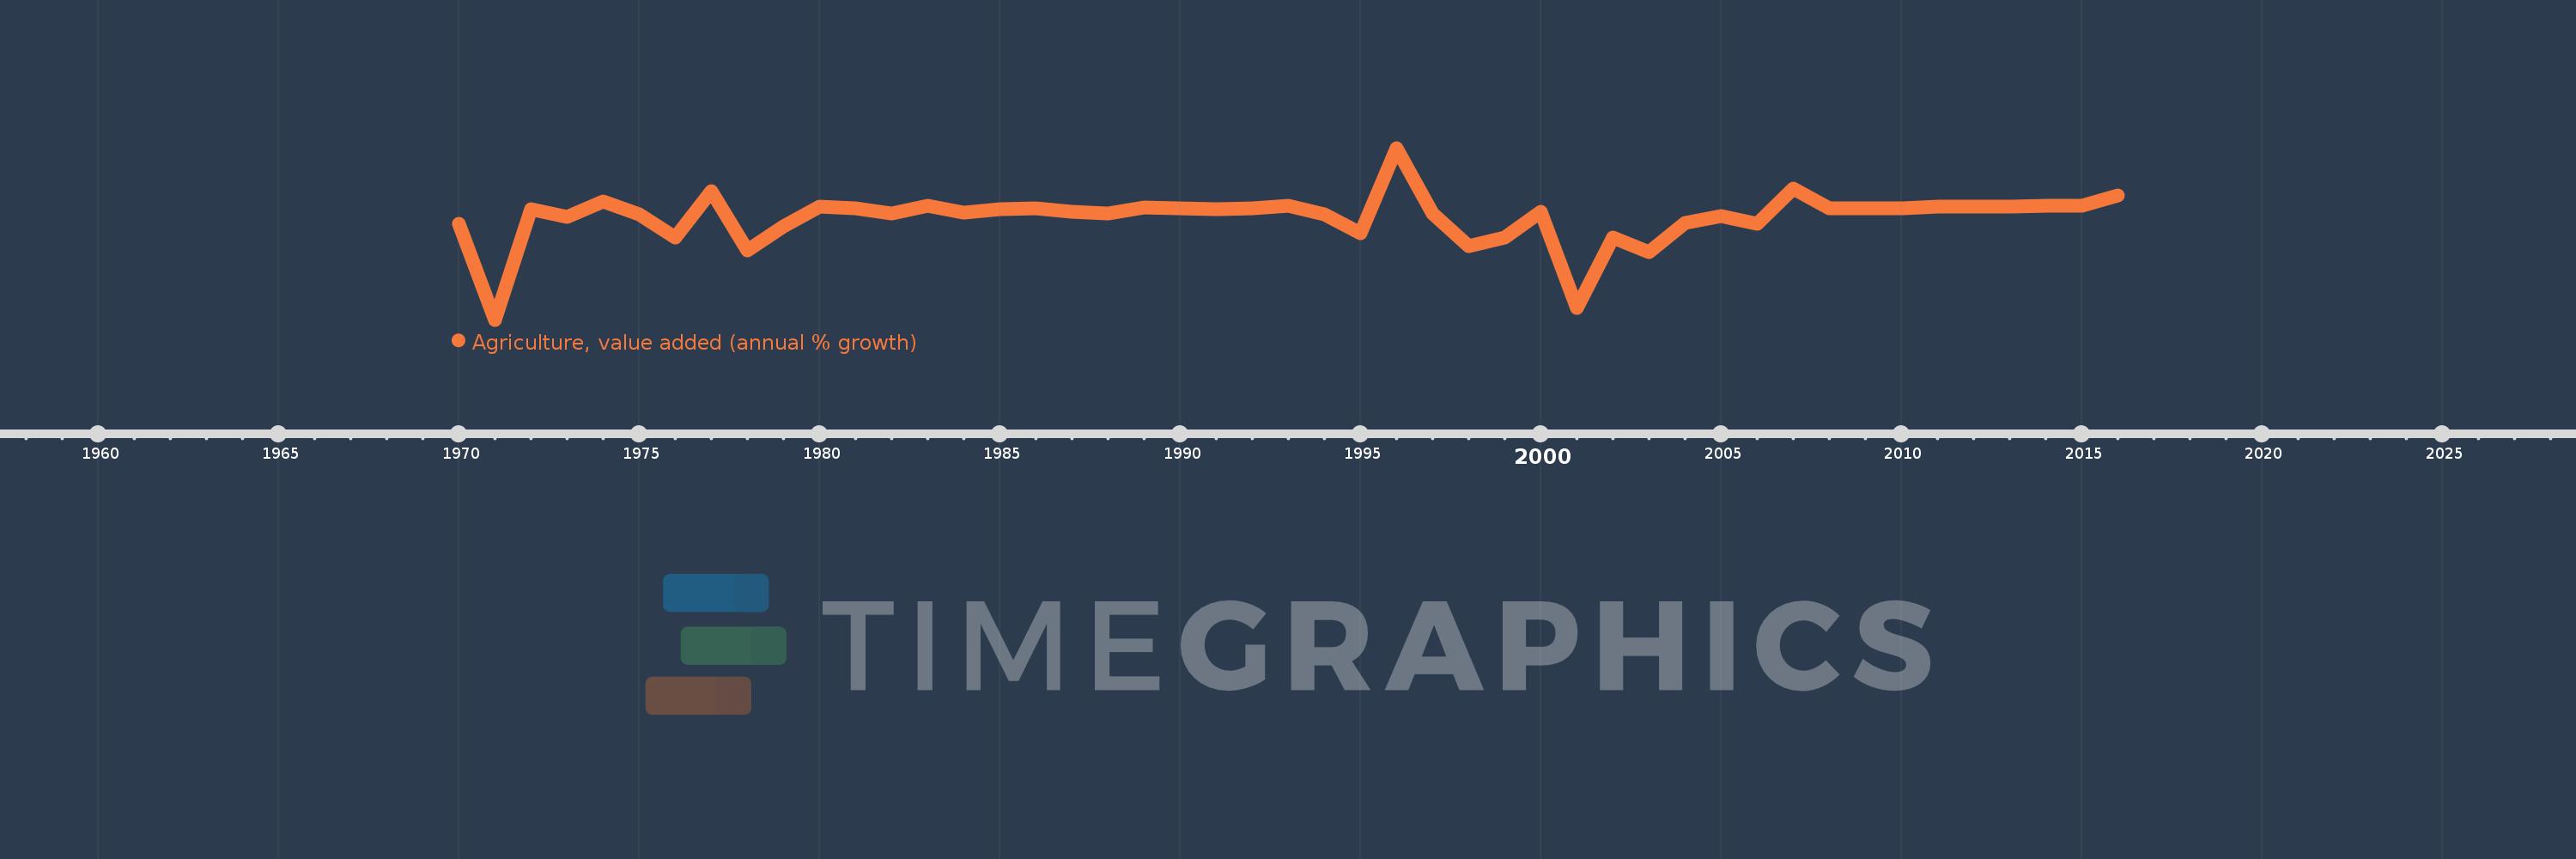
Agriculture, value added (annual % growth)
2016,2015,2014,2013,2012,2011,2010,2009,2008,2007,2006,2005,2004,2003,2002,2001,2000,1999,1998,1997,1996,1995,1994,1993,1992,1991,1990,1989,1988,1987,1986,1985,1984,1983,1982,1981,1980,1979,1978,1977,1976,1975,1974,1973,1972,1971,1970
This statistics in other country:
AfghanistanAlbaniaAlgeriaAntigua and BarbudaArab WorldArgentinaArmeniaAustraliaAustriaAzerbaijanBahamas, TheBahrainBangladeshBelarusBelgiumBelizeBeninBermudaBhutanBoliviaBosnia and HerzegovinaBotswanaBrazilBrunei DarussalamBulgariaBurkina FasoBurundiCabo VerdeCambodiaCameroonCanadaCaribbean small statesCayman IslandsCentral African RepublicCentral Europe and the BalticsChadChileChinaColombiaComorosCongo, Dem. Rep.Congo, Rep.Costa RicaCote d'IvoireCroatiaCubaCyprusCzech RepublicDenmarkDjiboutiDominicaDominican RepublicEarly-demographic dividendEast Asia & PacificEast Asia & Pacific (excluding high income)East Asia & Pacific (IDA & IBRD countries)EcuadorEgypt, Arab Rep.El SalvadorEquatorial GuineaEritreaEstoniaEthiopiaEuro areaEurope & Central AsiaEurope & Central Asia (excluding high income)Europe & Central Asia (IDA & IBRD countries)European UnionFijiFinlandFragile and conflict affected situationsFranceGabonGambia, TheGeorgiaGermanyGhanaGreeceGrenadaGuatemalaGuineaGuinea-BissauGuyanaHaitiHeavily indebted poor countries (HIPC)High incomeHondurasHong Kong SAR, ChinaHungaryIBRD onlyIcelandIDA & IBRD totalIDA blendIDA onlyIDA totalIndiaIndonesiaIran, Islamic Rep.IraqIrelandItalyJamaicaJapanJordanKazakhstanKenyaKiribatiKorea, Rep.KosovoKuwaitKyrgyz RepublicLao PDRLate-demographic dividendLatin America & Caribbean Latin America & Caribbean (excluding high income)Latin America & the Caribbean (IDA & IBRD countries)LatviaLeast developed countries: UN classificationLebanonLesothoLiberiaLithuaniaLow & middle incomeLow incomeLower middle incomeLuxembourgMacedonia, FYRMadagascarMalawiMalaysiaMaldivesMaliMarshall IslandsMauritaniaMauritiusMexicoMicronesia, Fed. Sts.Middle East & North AfricaMiddle East & North Africa (excluding high income)Middle East & North Africa (IDA & IBRD countries)Middle incomeMoldovaMongoliaMontenegroMoroccoMozambiqueMyanmarNamibiaNepalNetherlandsNew ZealandNicaraguaNigerNigeriaNorth AmericaNorwayOECD membersOmanOther small statesPakistanPalauPanamaPapua New GuineaParaguayPeruPhilippinesPolandPortugalPost-demographic dividendPre-demographic dividendPuerto RicoQatarRomaniaRussian FederationRwandaSamoaSao Tome and PrincipeSaudi ArabiaSenegalSerbiaSeychellesSierra LeoneSingaporeSlovak RepublicSloveniaSmall statesSolomon IslandsSomaliaSouth AfricaSouth AsiaSouth Asia (IDA & IBRD)SpainSri LankaSt. Kitts and NevisSt. LuciaSt. Vincent and the GrenadinesSub-Saharan Africa Sub-Saharan Africa (excluding high income)Sub-Saharan Africa (IDA & IBRD countries)SudanSurinameSwazilandSwedenSwitzerlandSyrian Arab RepublicTajikistanTanzaniaThailandTimor-LesteTogoTongaTrinidad and TobagoTunisiaTurkeyTurkmenistanTuvaluUgandaUkraineUnited Arab EmiratesUnited KingdomUnited StatesUpper middle incomeUruguayUzbekistanVanuatuVenezuela, RBVietnamWest Bank and GazaWorldZambiaZimbabwe Timeline:
This timeline shows a graph from 1970 to 2016 of Congo, Dem. Rep.. No data until 1969. Number of actual observations by date: 47.
Source name:
World Development Indicators
Source organization:
World Bank national accounts data, and OECD National Accounts data files.
Categories, topics:
Economy & Growth
Last updated:
apr 23, 2017
Indicators value changes by year
Minimum:
-13.46
jan 1, 1971
Maximum:
11.605
jan 1, 1996
At the date of observation
Value
Absolute change
Change from previous value
jan 1, 1970
0.493
+0.493
0.0%
jan 1, 1971
-13.46
-13.953
-2.83K%
jan 1, 1972
2.708
+16.168
-120.11%
jan 1, 1973
1.533
-1.175
-43.39%
jan 1, 1974
3.805
+2.272
148.25%
jan 1, 1975
1.977
-1.828
-48.04%
jan 1, 1976
-1.483
-3.46
-175.02%
jan 1, 1977
5.328
+6.811
-459.26%
jan 1, 1978
-3.299
-8.627
-161.91%
jan 1, 1979
0.171
+3.47
-105.17%
jan 1, 1980
3.065
+2.895
1.7K%
jan 1, 1981
2.808
-0.257
-8.4%
jan 1, 1982
2.004
-0.804
-28.64%
jan 1, 1983
3.201
+1.197
59.74%
jan 1, 1984
2.117
-1.083
-33.85%
jan 1, 1985
2.624
+0.507
23.92%
jan 1, 1986
2.759
+0.135
5.16%
jan 1, 1987
2.356
-0.403
-14.6%
jan 1, 1988
2.034
-0.323
-13.7%
jan 1, 1989
2.924
+0.89
43.75%
jan 1, 1990
2.802
-0.122
-4.17%
jan 1, 1991
2.612
-0.19
-6.78%
jan 1, 1992
2.803
+0.192
7.34%
jan 1, 1993
3.122
+0.318
11.35%
jan 1, 1994
1.879
-1.243
-39.81%
jan 1, 1995
-0.82
-2.699
-143.62%
jan 1, 1996
11.605
+12.424
-1.52K%
jan 1, 1997
2.1
-9.505
-81.9%
jan 1, 1998
-2.72
-4.82
-229.54%
jan 1, 1999
-1.454
+1.266
-46.55%
jan 1, 2000
2.3
+3.754
-258.17%
jan 1, 2001
-11.7
-14.0
-608.69%
jan 1, 2002
-1.507
+10.193
-87.12%
jan 1, 2003
-3.634
-2.128
141.2%
jan 1, 2004
0.664
+4.298
-118.26%
jan 1, 2005
1.61
+0.947
142.69%
jan 1, 2006
0.485
-1.126
-69.91%
jan 1, 2007
5.631
+5.146
1.06K%
jan 1, 2008
2.77
-2.861
-50.81%
jan 1, 2009
2.77
+0.001
0.02%
jan 1, 2010
2.784
+0.013
0.48%
jan 1, 2011
3.01
+0.226
8.13%
jan 1, 2013
3.01
+0.0
0.0%
jan 1, 2014
3.2
+0.19
6.31%
jan 1, 2016
4.657
+1.457
45.53%
Ranking of countries by current statistics by years


Comments: