29
/
en
AIzaSyAYiBZKx7MnpbEhh9jyipgxe19OcubqV5w
April 1, 2024
130085
Ethiopia
ETH
true
2
1
Agriculture, value added (annual % growth)
2016,2015,2014,2013,2012,2011,2010,2009,2008,2007,2006,2005,2004,2003,2002,2001,2000,1999,1998,1997,1996,1995,1994,1993,1992,1991,1990,1989,1988,1987,1986,1985,1984,1983
This statistics in other country:
AfghanistanAlbaniaAlgeriaAntigua and BarbudaArab WorldArgentinaArmeniaAustraliaAustriaAzerbaijanBahamas, TheBahrainBangladeshBelarusBelgiumBelizeBeninBermudaBhutanBoliviaBosnia and HerzegovinaBotswanaBrazilBrunei DarussalamBulgariaBurkina FasoBurundiCabo VerdeCambodiaCameroonCanadaCaribbean small statesCayman IslandsCentral African RepublicCentral Europe and the BalticsChadChileChinaColombiaComorosCongo, Dem. Rep.Congo, Rep.Costa RicaCote d'IvoireCroatiaCubaCyprusCzech RepublicDenmarkDjiboutiDominicaDominican RepublicEarly-demographic dividendEast Asia & PacificEast Asia & Pacific (excluding high income)East Asia & Pacific (IDA & IBRD countries)EcuadorEgypt, Arab Rep.El SalvadorEquatorial GuineaEritreaEstoniaEthiopiaEuro areaEurope & Central AsiaEurope & Central Asia (excluding high income)Europe & Central Asia (IDA & IBRD countries)European UnionFijiFinlandFragile and conflict affected situationsFranceGabonGambia, TheGeorgiaGermanyGhanaGreeceGrenadaGuatemalaGuineaGuinea-BissauGuyanaHaitiHeavily indebted poor countries (HIPC)High incomeHondurasHong Kong SAR, ChinaHungaryIBRD onlyIcelandIDA & IBRD totalIDA blendIDA onlyIDA totalIndiaIndonesiaIran, Islamic Rep.IraqIrelandItalyJamaicaJapanJordanKazakhstanKenyaKiribatiKorea, Rep.KosovoKuwaitKyrgyz RepublicLao PDRLate-demographic dividendLatin America & Caribbean Latin America & Caribbean (excluding high income)Latin America & the Caribbean (IDA & IBRD countries)LatviaLeast developed countries: UN classificationLebanonLesothoLiberiaLithuaniaLow & middle incomeLow incomeLower middle incomeLuxembourgMacedonia, FYRMadagascarMalawiMalaysiaMaldivesMaliMarshall IslandsMauritaniaMauritiusMexicoMicronesia, Fed. Sts.Middle East & North AfricaMiddle East & North Africa (excluding high income)Middle East & North Africa (IDA & IBRD countries)Middle incomeMoldovaMongoliaMontenegroMoroccoMozambiqueMyanmarNamibiaNepalNetherlandsNew ZealandNicaraguaNigerNigeriaNorth AmericaNorwayOECD membersOmanOther small statesPakistanPalauPanamaPapua New GuineaParaguayPeruPhilippinesPolandPortugalPost-demographic dividendPre-demographic dividendPuerto RicoQatarRomaniaRussian FederationRwandaSamoaSao Tome and PrincipeSaudi ArabiaSenegalSerbiaSeychellesSierra LeoneSingaporeSlovak RepublicSloveniaSmall statesSolomon IslandsSomaliaSouth AfricaSouth AsiaSouth Asia (IDA & IBRD)SpainSri LankaSt. Kitts and NevisSt. LuciaSt. Vincent and the GrenadinesSub-Saharan Africa Sub-Saharan Africa (excluding high income)Sub-Saharan Africa (IDA & IBRD countries)SudanSurinameSwazilandSwedenSwitzerlandSyrian Arab RepublicTajikistanTanzaniaThailandTimor-LesteTogoTongaTrinidad and TobagoTunisiaTurkeyTurkmenistanTuvaluUgandaUkraineUnited Arab EmiratesUnited KingdomUnited StatesUpper middle incomeUruguayUzbekistanVanuatuVenezuela, RBVietnamWest Bank and GazaWorldZambiaZimbabwe Timeline:
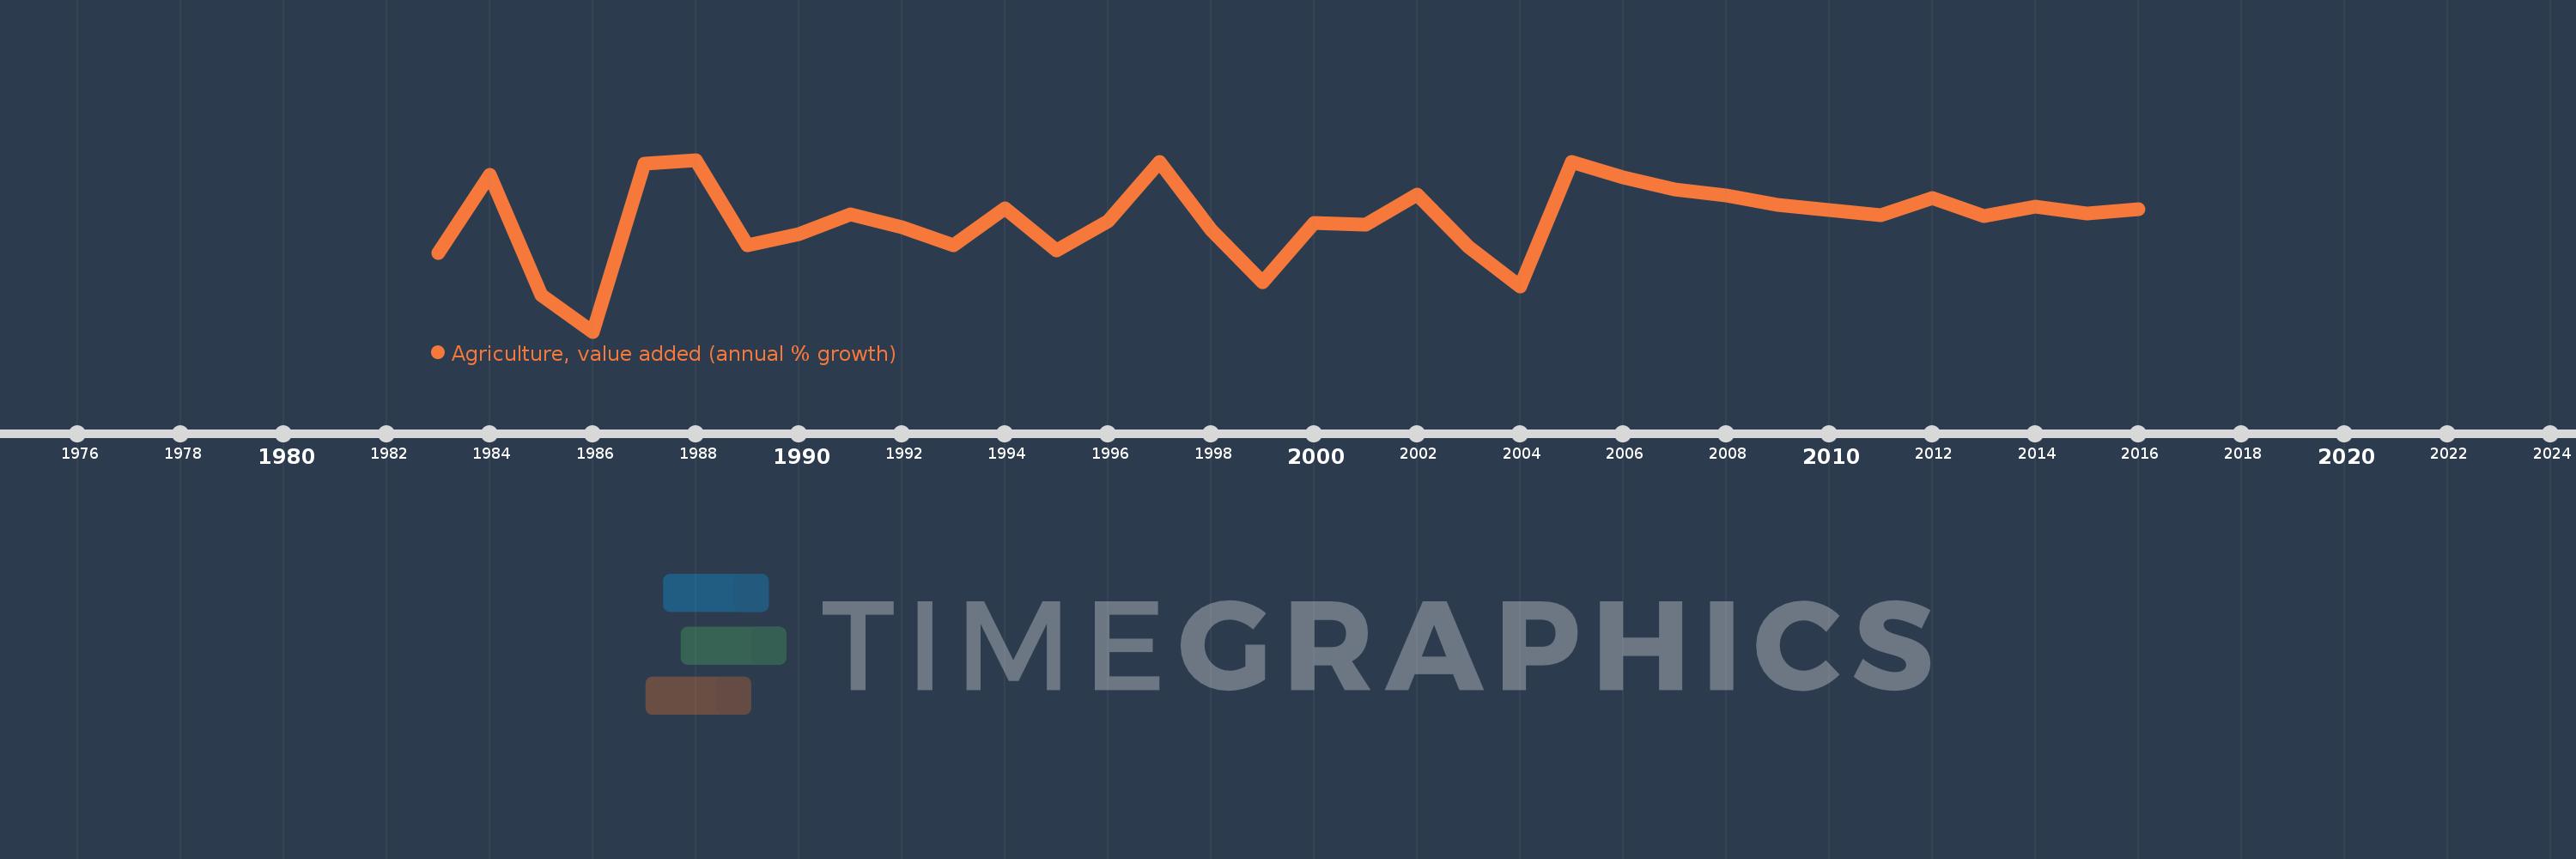
This timeline shows a graph from 1983 to 2016 of Ethiopia. No data until 1982. Number of actual observations by date: 34.
Source name:
World Development Indicators
Source organization:
World Bank national accounts data, and OECD National Accounts data files.
Categories, topics:
Economy & Growth
Last updated:
apr 23, 2017
Indicators value changes by year
Minimum:
-20.528
jan 1, 1986
Maximum:
17.381
jan 1, 1988
At the date of observation
Value
Absolute change
Change from previous value
jan 1, 1983
-3.141
-3.141
0.0%
jan 1, 1984
14.055
+17.195
-547.52%
jan 1, 1985
-12.39
-26.445
-188.15%
jan 1, 1986
-20.528
-8.139
65.69%
jan 1, 1987
16.518
+37.047
-180.47%
jan 1, 1988
17.381
+0.863
5.22%
jan 1, 1989
-1.442
-18.824
-108.3%
jan 1, 1990
0.936
+2.379
-164.91%
jan 1, 1991
5.425
+4.489
479.42%
jan 1, 1992
2.472
-2.953
-54.43%
jan 1, 1993
-1.566
-4.039
-163.36%
jan 1, 1994
6.587
+8.153
-520.5%
jan 1, 1995
-2.58
-9.167
-139.17%
jan 1, 1996
3.767
+6.347
-246.01%
jan 1, 1997
16.962
+13.195
350.31%
jan 1, 1998
2.002
-14.96
-88.2%
jan 1, 1999
-9.64
-11.642
-581.5%
jan 1, 2000
3.398
+13.038
-135.25%
jan 1, 2001
3.053
-0.345
-10.14%
jan 1, 2002
9.624
+6.571
215.22%
jan 1, 2003
-1.876
-11.5
-119.49%
jan 1, 2004
-10.485
-8.609
459.03%
jan 1, 2005
16.945
+27.43
-261.61%
jan 1, 2006
13.543
-3.402
-20.08%
jan 1, 2007
10.909
-2.634
-19.45%
jan 1, 2008
9.448
-1.46
-13.39%
jan 1, 2009
7.501
-1.947
-20.61%
jan 1, 2010
6.361
-1.141
-15.2%
jan 1, 2011
5.13
-1.231
-19.35%
jan 1, 2012
9.015
+3.885
75.72%
jan 1, 2013
4.922
-4.093
-45.4%
jan 1, 2014
7.098
+2.176
44.22%
jan 1, 2015
5.447
-1.652
-23.27%
jan 1, 2016
6.395
+0.948
17.41%
Ranking of countries by current statistics by years


Comments: