29
/
en
AIzaSyAYiBZKx7MnpbEhh9jyipgxe19OcubqV5w
April 1, 2024
281903
Vietnam
VNM
true
2
1
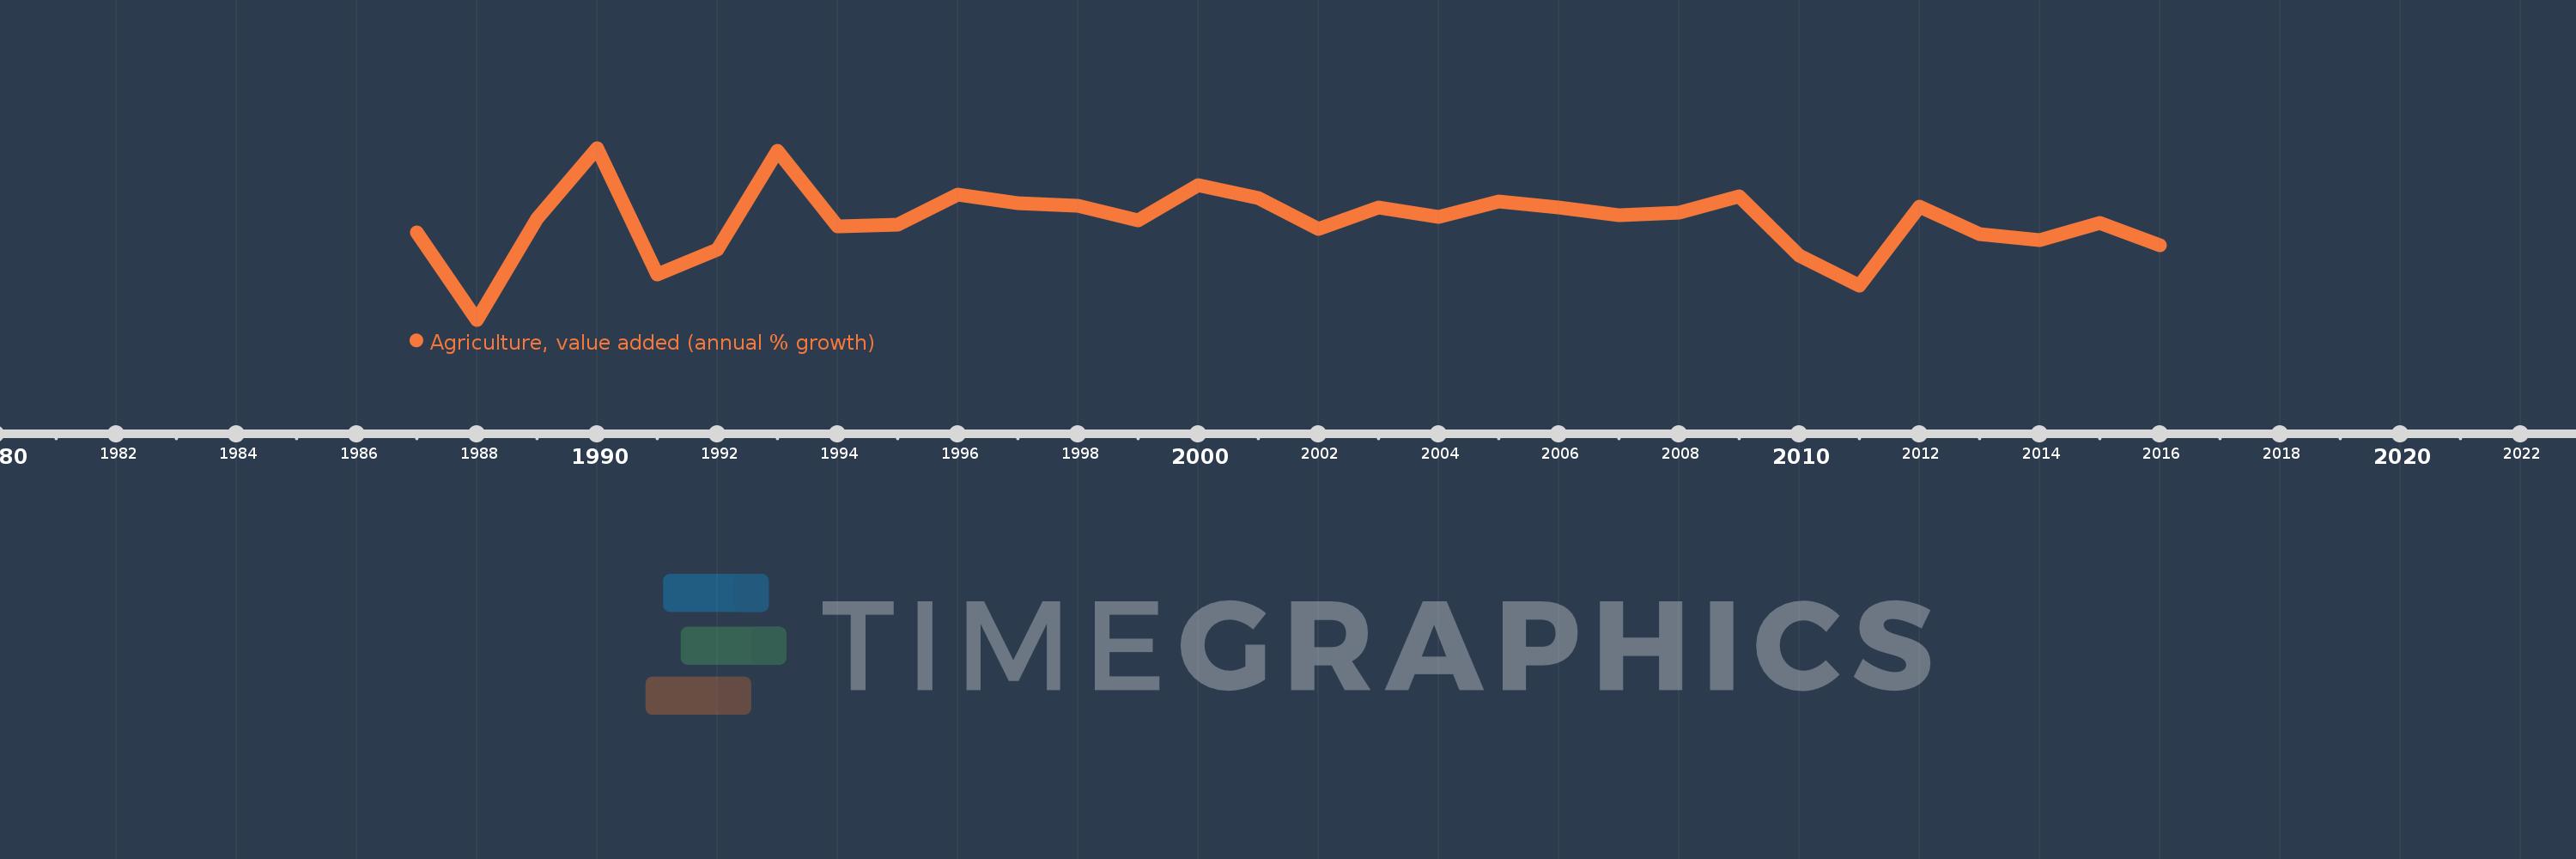
Agriculture, value added (annual % growth)
2016,2015,2014,2013,2012,2011,2010,2009,2008,2007,2006,2005,2004,2003,2002,2001,2000,1999,1998,1997,1996,1995,1994,1993,1992,1991,1990,1989,1988,1987
This statistics in other country:
AfghanistanAlbaniaAlgeriaAntigua and BarbudaArab WorldArgentinaArmeniaAustraliaAustriaAzerbaijanBahamas, TheBahrainBangladeshBelarusBelgiumBelizeBeninBermudaBhutanBoliviaBosnia and HerzegovinaBotswanaBrazilBrunei DarussalamBulgariaBurkina FasoBurundiCabo VerdeCambodiaCameroonCanadaCaribbean small statesCayman IslandsCentral African RepublicCentral Europe and the BalticsChadChileChinaColombiaComorosCongo, Dem. Rep.Congo, Rep.Costa RicaCote d'IvoireCroatiaCubaCyprusCzech RepublicDenmarkDjiboutiDominicaDominican RepublicEarly-demographic dividendEast Asia & PacificEast Asia & Pacific (excluding high income)East Asia & Pacific (IDA & IBRD countries)EcuadorEgypt, Arab Rep.El SalvadorEquatorial GuineaEritreaEstoniaEthiopiaEuro areaEurope & Central AsiaEurope & Central Asia (excluding high income)Europe & Central Asia (IDA & IBRD countries)European UnionFijiFinlandFragile and conflict affected situationsFranceGabonGambia, TheGeorgiaGermanyGhanaGreeceGrenadaGuatemalaGuineaGuinea-BissauGuyanaHaitiHeavily indebted poor countries (HIPC)High incomeHondurasHong Kong SAR, ChinaHungaryIBRD onlyIcelandIDA & IBRD totalIDA blendIDA onlyIDA totalIndiaIndonesiaIran, Islamic Rep.IraqIrelandItalyJamaicaJapanJordanKazakhstanKenyaKiribatiKorea, Rep.KosovoKuwaitKyrgyz RepublicLao PDRLate-demographic dividendLatin America & Caribbean Latin America & Caribbean (excluding high income)Latin America & the Caribbean (IDA & IBRD countries)LatviaLeast developed countries: UN classificationLebanonLesothoLiberiaLithuaniaLow & middle incomeLow incomeLower middle incomeLuxembourgMacedonia, FYRMadagascarMalawiMalaysiaMaldivesMaliMarshall IslandsMauritaniaMauritiusMexicoMicronesia, Fed. Sts.Middle East & North AfricaMiddle East & North Africa (excluding high income)Middle East & North Africa (IDA & IBRD countries)Middle incomeMoldovaMongoliaMontenegroMoroccoMozambiqueMyanmarNamibiaNepalNetherlandsNew ZealandNicaraguaNigerNigeriaNorth AmericaNorwayOECD membersOmanOther small statesPakistanPalauPanamaPapua New GuineaParaguayPeruPhilippinesPolandPortugalPost-demographic dividendPre-demographic dividendPuerto RicoQatarRomaniaRussian FederationRwandaSamoaSao Tome and PrincipeSaudi ArabiaSenegalSerbiaSeychellesSierra LeoneSingaporeSlovak RepublicSloveniaSmall statesSolomon IslandsSomaliaSouth AfricaSouth AsiaSouth Asia (IDA & IBRD)SpainSri LankaSt. Kitts and NevisSt. LuciaSt. Vincent and the GrenadinesSub-Saharan Africa Sub-Saharan Africa (excluding high income)Sub-Saharan Africa (IDA & IBRD countries)SudanSurinameSwazilandSwedenSwitzerlandSyrian Arab RepublicTajikistanTanzaniaThailandTimor-LesteTogoTongaTrinidad and TobagoTunisiaTurkeyTurkmenistanTuvaluUgandaUkraineUnited Arab EmiratesUnited KingdomUnited StatesUpper middle incomeUruguayUzbekistanVanuatuVenezuela, RBVietnamWest Bank and GazaWorldZambiaZimbabwe Timeline:
This timeline shows a graph from 1987 to 2016 of Vietnam. No data until 1986. Number of actual observations by date: 30.
Source name:
World Development Indicators
Source organization:
World Bank national accounts data, and OECD National Accounts data files.
Categories, topics:
Economy & Growth
Last updated:
apr 23, 2017
Indicators value changes by year
Minimum:
-1.142
jan 1, 1988
At the date of observation
Value
Absolute change
Change from previous value
jan 1, 1987
2.987
+2.987
0.0%
jan 1, 1988
-1.142
-4.128
-138.22%
jan 1, 1989
3.648
+4.79
-419.58%
jan 1, 1990
7.003
+3.355
91.97%
jan 1, 1991
0.995
-6.008
-85.79%
jan 1, 1992
2.176
+1.181
118.59%
jan 1, 1993
6.878
+4.702
216.1%
jan 1, 1994
3.279
-3.599
-52.33%
jan 1, 1995
3.367
+0.088
2.68%
jan 1, 1996
4.801
+1.434
42.6%
jan 1, 1997
4.4
-0.401
-8.36%
jan 1, 1998
4.262
-0.138
-3.14%
jan 1, 1999
3.59
-0.672
-15.76%
jan 1, 2000
5.235
+1.644
45.8%
jan 1, 2001
4.634
-0.6
-11.47%
jan 1, 2002
3.172
-1.463
-31.56%
jan 1, 2003
4.187
+1.015
32.01%
jan 1, 2004
3.713
-0.473
-11.31%
jan 1, 2005
4.458
+0.745
20.05%
jan 1, 2006
4.189
-0.269
-6.03%
jan 1, 2007
3.798
-0.391
-9.34%
jan 1, 2008
3.955
+0.157
4.14%
jan 1, 2009
4.692
+0.737
18.63%
jan 1, 2010
1.91
-2.782
-59.3%
jan 1, 2011
0.486
-1.424
-74.55%
jan 1, 2012
4.234
+3.748
771.26%
jan 1, 2013
2.922
-1.312
-30.99%
jan 1, 2014
2.632
-0.29
-9.93%
jan 1, 2015
3.439
+0.808
30.69%
jan 1, 2016
2.408
-1.031
-29.98%
Ranking of countries by current statistics by years


Comments: