29
/
en
AIzaSyAYiBZKx7MnpbEhh9jyipgxe19OcubqV5w
April 1, 2024
169630
Korea, Rep.
KOR
true
2
1
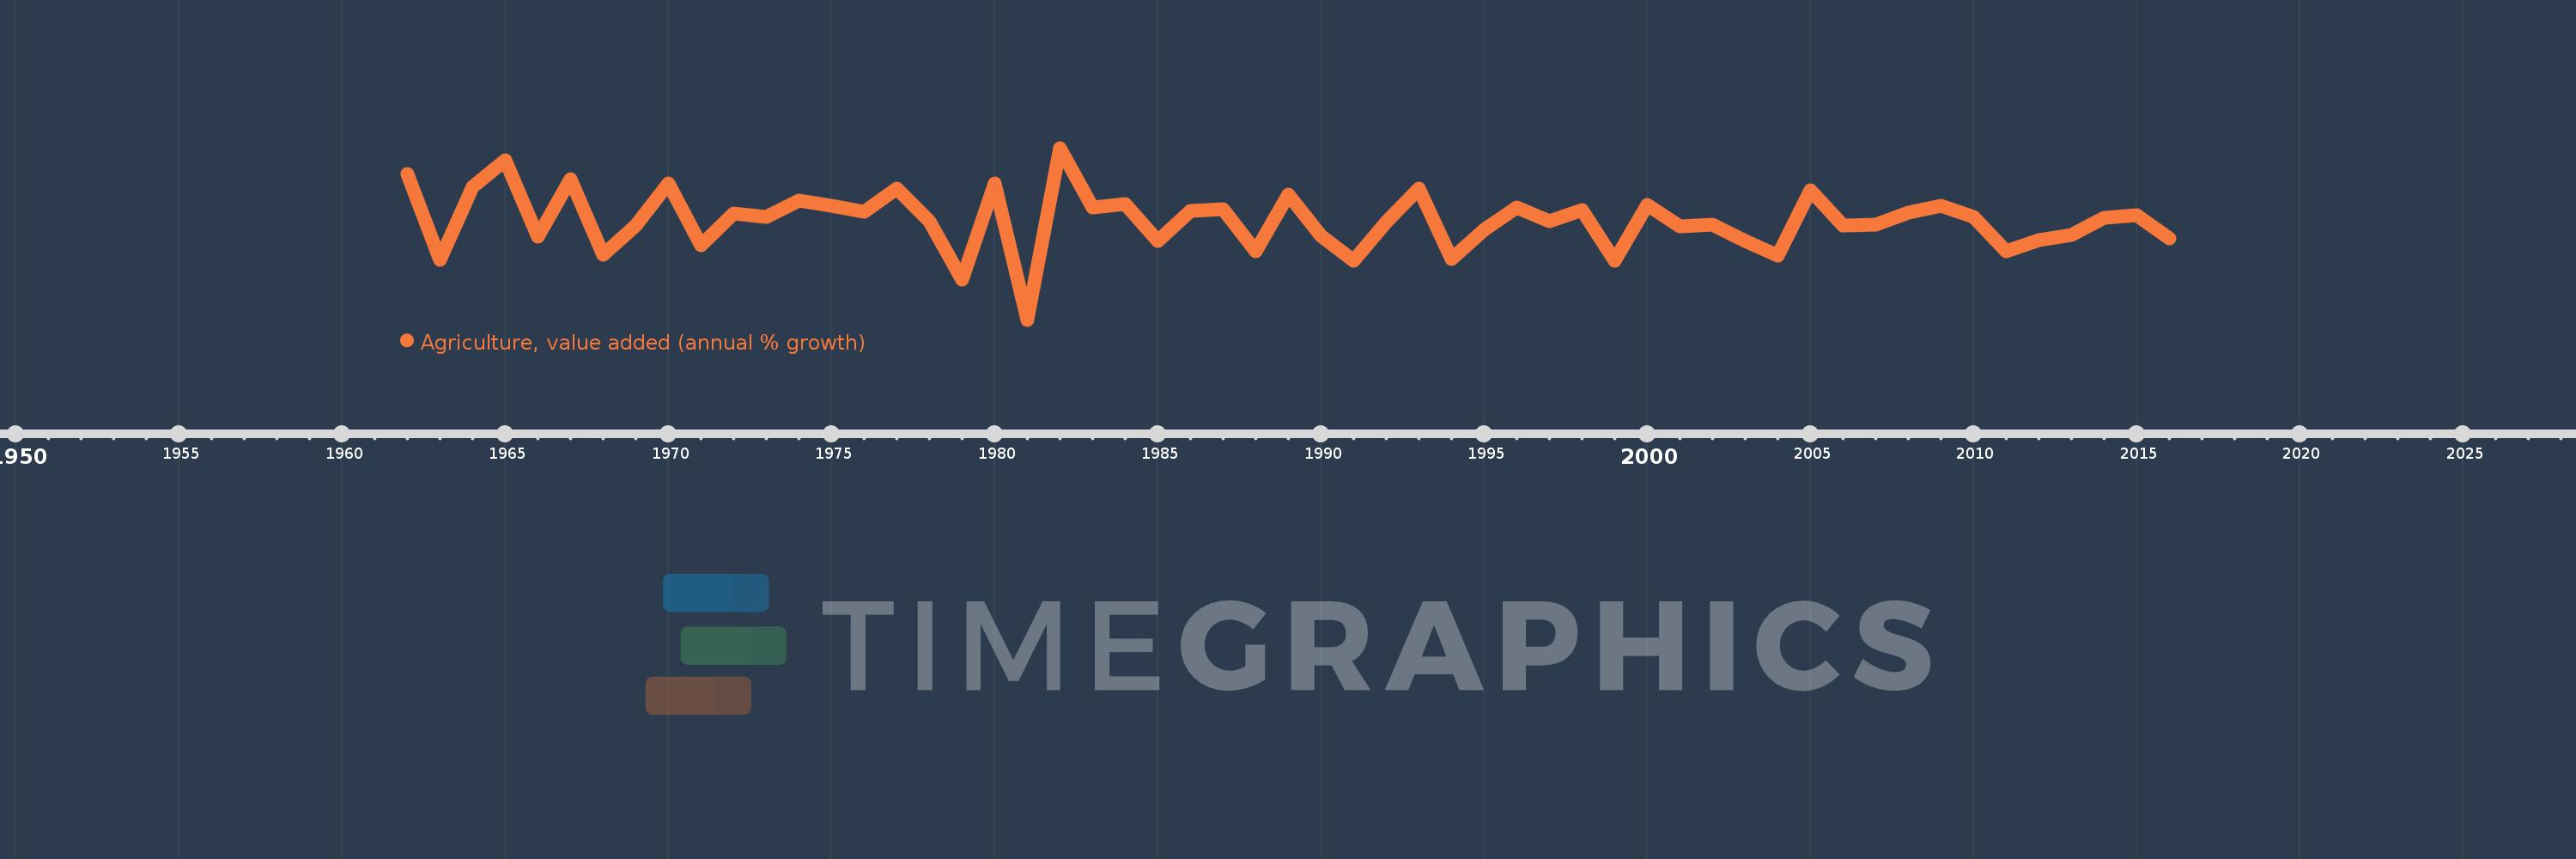
Agriculture, value added (annual % growth)
2016,2015,2014,2013,2012,2011,2010,2009,2008,2007,2006,2005,2004,2003,2002,2001,2000,1999,1998,1997,1996,1995,1994,1993,1992,1991,1990,1989,1988,1987,1986,1985,1984,1983,1982,1981,1980,1979,1978,1977,1976,1975,1974,1973,1972,1971,1970,1969,1968,1967,1966,1965,1964,1963,1962
This statistics in other country:
AfghanistanAlbaniaAlgeriaAntigua and BarbudaArab WorldArgentinaArmeniaAustraliaAustriaAzerbaijanBahamas, TheBahrainBangladeshBelarusBelgiumBelizeBeninBermudaBhutanBoliviaBosnia and HerzegovinaBotswanaBrazilBrunei DarussalamBulgariaBurkina FasoBurundiCabo VerdeCambodiaCameroonCanadaCaribbean small statesCayman IslandsCentral African RepublicCentral Europe and the BalticsChadChileChinaColombiaComorosCongo, Dem. Rep.Congo, Rep.Costa RicaCote d'IvoireCroatiaCubaCyprusCzech RepublicDenmarkDjiboutiDominicaDominican RepublicEarly-demographic dividendEast Asia & PacificEast Asia & Pacific (excluding high income)East Asia & Pacific (IDA & IBRD countries)EcuadorEgypt, Arab Rep.El SalvadorEquatorial GuineaEritreaEstoniaEthiopiaEuro areaEurope & Central AsiaEurope & Central Asia (excluding high income)Europe & Central Asia (IDA & IBRD countries)European UnionFijiFinlandFragile and conflict affected situationsFranceGabonGambia, TheGeorgiaGermanyGhanaGreeceGrenadaGuatemalaGuineaGuinea-BissauGuyanaHaitiHeavily indebted poor countries (HIPC)High incomeHondurasHong Kong SAR, ChinaHungaryIBRD onlyIcelandIDA & IBRD totalIDA blendIDA onlyIDA totalIndiaIndonesiaIran, Islamic Rep.IraqIrelandItalyJamaicaJapanJordanKazakhstanKenyaKiribatiKorea, Rep.KosovoKuwaitKyrgyz RepublicLao PDRLate-demographic dividendLatin America & Caribbean Latin America & Caribbean (excluding high income)Latin America & the Caribbean (IDA & IBRD countries)LatviaLeast developed countries: UN classificationLebanonLesothoLiberiaLithuaniaLow & middle incomeLow incomeLower middle incomeLuxembourgMacedonia, FYRMadagascarMalawiMalaysiaMaldivesMaliMarshall IslandsMauritaniaMauritiusMexicoMicronesia, Fed. Sts.Middle East & North AfricaMiddle East & North Africa (excluding high income)Middle East & North Africa (IDA & IBRD countries)Middle incomeMoldovaMongoliaMontenegroMoroccoMozambiqueMyanmarNamibiaNepalNetherlandsNew ZealandNicaraguaNigerNigeriaNorth AmericaNorwayOECD membersOmanOther small statesPakistanPalauPanamaPapua New GuineaParaguayPeruPhilippinesPolandPortugalPost-demographic dividendPre-demographic dividendPuerto RicoQatarRomaniaRussian FederationRwandaSamoaSao Tome and PrincipeSaudi ArabiaSenegalSerbiaSeychellesSierra LeoneSingaporeSlovak RepublicSloveniaSmall statesSolomon IslandsSomaliaSouth AfricaSouth AsiaSouth Asia (IDA & IBRD)SpainSri LankaSt. Kitts and NevisSt. LuciaSt. Vincent and the GrenadinesSub-Saharan Africa Sub-Saharan Africa (excluding high income)Sub-Saharan Africa (IDA & IBRD countries)SudanSurinameSwazilandSwedenSwitzerlandSyrian Arab RepublicTajikistanTanzaniaThailandTimor-LesteTogoTongaTrinidad and TobagoTunisiaTurkeyTurkmenistanTuvaluUgandaUkraineUnited Arab EmiratesUnited KingdomUnited StatesUpper middle incomeUruguayUzbekistanVanuatuVenezuela, RBVietnamWest Bank and GazaWorldZambiaZimbabwe Timeline:
This timeline shows a graph from 1962 to 2016 of Korea, Rep.. No data until 1961. Number of actual observations by date: 55.
Source name:
World Development Indicators
Source organization:
World Bank national accounts data, and OECD National Accounts data files.
Categories, topics:
Economy & Growth
Last updated:
apr 23, 2017
Indicators value changes by year
Minimum:
-19.411
jan 1, 1981
Maximum:
18.363
jan 1, 1982
At the date of observation
Value
Absolute change
Change from previous value
jan 1, 1962
12.633
+12.633
0.0%
jan 1, 1963
-6.293
-18.926
-149.82%
jan 1, 1964
9.789
+16.082
-255.54%
jan 1, 1965
15.634
+5.845
59.71%
jan 1, 1966
-1.075
-16.709
-106.87%
jan 1, 1967
11.6
+12.675
-1.18K%
jan 1, 1968
-5.1
-16.7
-143.97%
jan 1, 1969
1.3
+6.401
-125.5%
jan 1, 1970
10.5
+9.2
707.5%
jan 1, 1971
-3.072
-13.572
-129.25%
jan 1, 1972
3.91
+6.981
-227.29%
jan 1, 1973
3.236
-0.673
-17.22%
jan 1, 1974
6.843
+3.607
111.45%
jan 1, 1975
5.618
-1.226
-17.91%
jan 1, 1976
4.332
-1.286
-22.89%
jan 1, 1977
9.512
+5.18
119.59%
jan 1, 1978
2.287
-7.225
-75.96%
jan 1, 1979
-10.661
-12.948
-566.21%
jan 1, 1980
10.613
+21.275
-199.55%
jan 1, 1981
-19.411
-30.024
-282.9%
jan 1, 1982
18.363
+37.774
-194.6%
jan 1, 1983
5.271
-13.092
-71.3%
jan 1, 1984
6.021
+0.75
14.24%
jan 1, 1985
-2.081
-8.103
-134.56%
jan 1, 1986
4.515
+6.596
-316.96%
jan 1, 1987
4.834
+0.319
7.06%
jan 1, 1988
-4.378
-9.212
-190.57%
jan 1, 1989
8.162
+12.54
-286.41%
jan 1, 1990
-0.984
-9.145
-112.05%
jan 1, 1991
-6.492
-5.508
559.89%
jan 1, 1992
2.034
+8.526
-131.33%
jan 1, 1993
9.341
+7.307
359.19%
jan 1, 1994
-5.975
-15.316
-163.96%
jan 1, 1995
0.398
+6.372
-106.66%
jan 1, 1996
5.263
+4.866
1.22K%
jan 1, 1997
2.303
-2.96
-56.24%
jan 1, 1998
4.618
+2.315
100.49%
jan 1, 1999
-6.379
-10.997
-238.13%
jan 1, 2000
5.887
+12.266
-192.29%
jan 1, 2001
1.211
-4.676
-79.43%
jan 1, 2002
1.576
+0.365
30.13%
jan 1, 2003
-2.148
-3.724
-236.3%
jan 1, 2004
-5.309
-3.161
147.16%
jan 1, 2005
9.013
+14.322
-269.75%
jan 1, 2006
1.397
-7.616
-84.5%
jan 1, 2007
1.56
+0.164
11.74%
jan 1, 2008
4.071
+2.51
160.87%
jan 1, 2009
5.599
+1.528
37.54%
jan 1, 2010
3.243
-2.356
-42.07%
jan 1, 2011
-4.322
-7.565
-233.26%
jan 1, 2012
-1.954
+2.368
-54.79%
jan 1, 2013
-0.856
+1.098
-56.19%
jan 1, 2014
3.093
+3.949
-461.28%
jan 1, 2015
3.599
+0.506
16.36%
jan 1, 2016
-1.453
-5.052
-140.39%
Ranking of countries by current statistics by years


Comments: