29
/
en
AIzaSyAYiBZKx7MnpbEhh9jyipgxe19OcubqV5w
April 1, 2024
212595
Nigeria
NGA
true
2
1
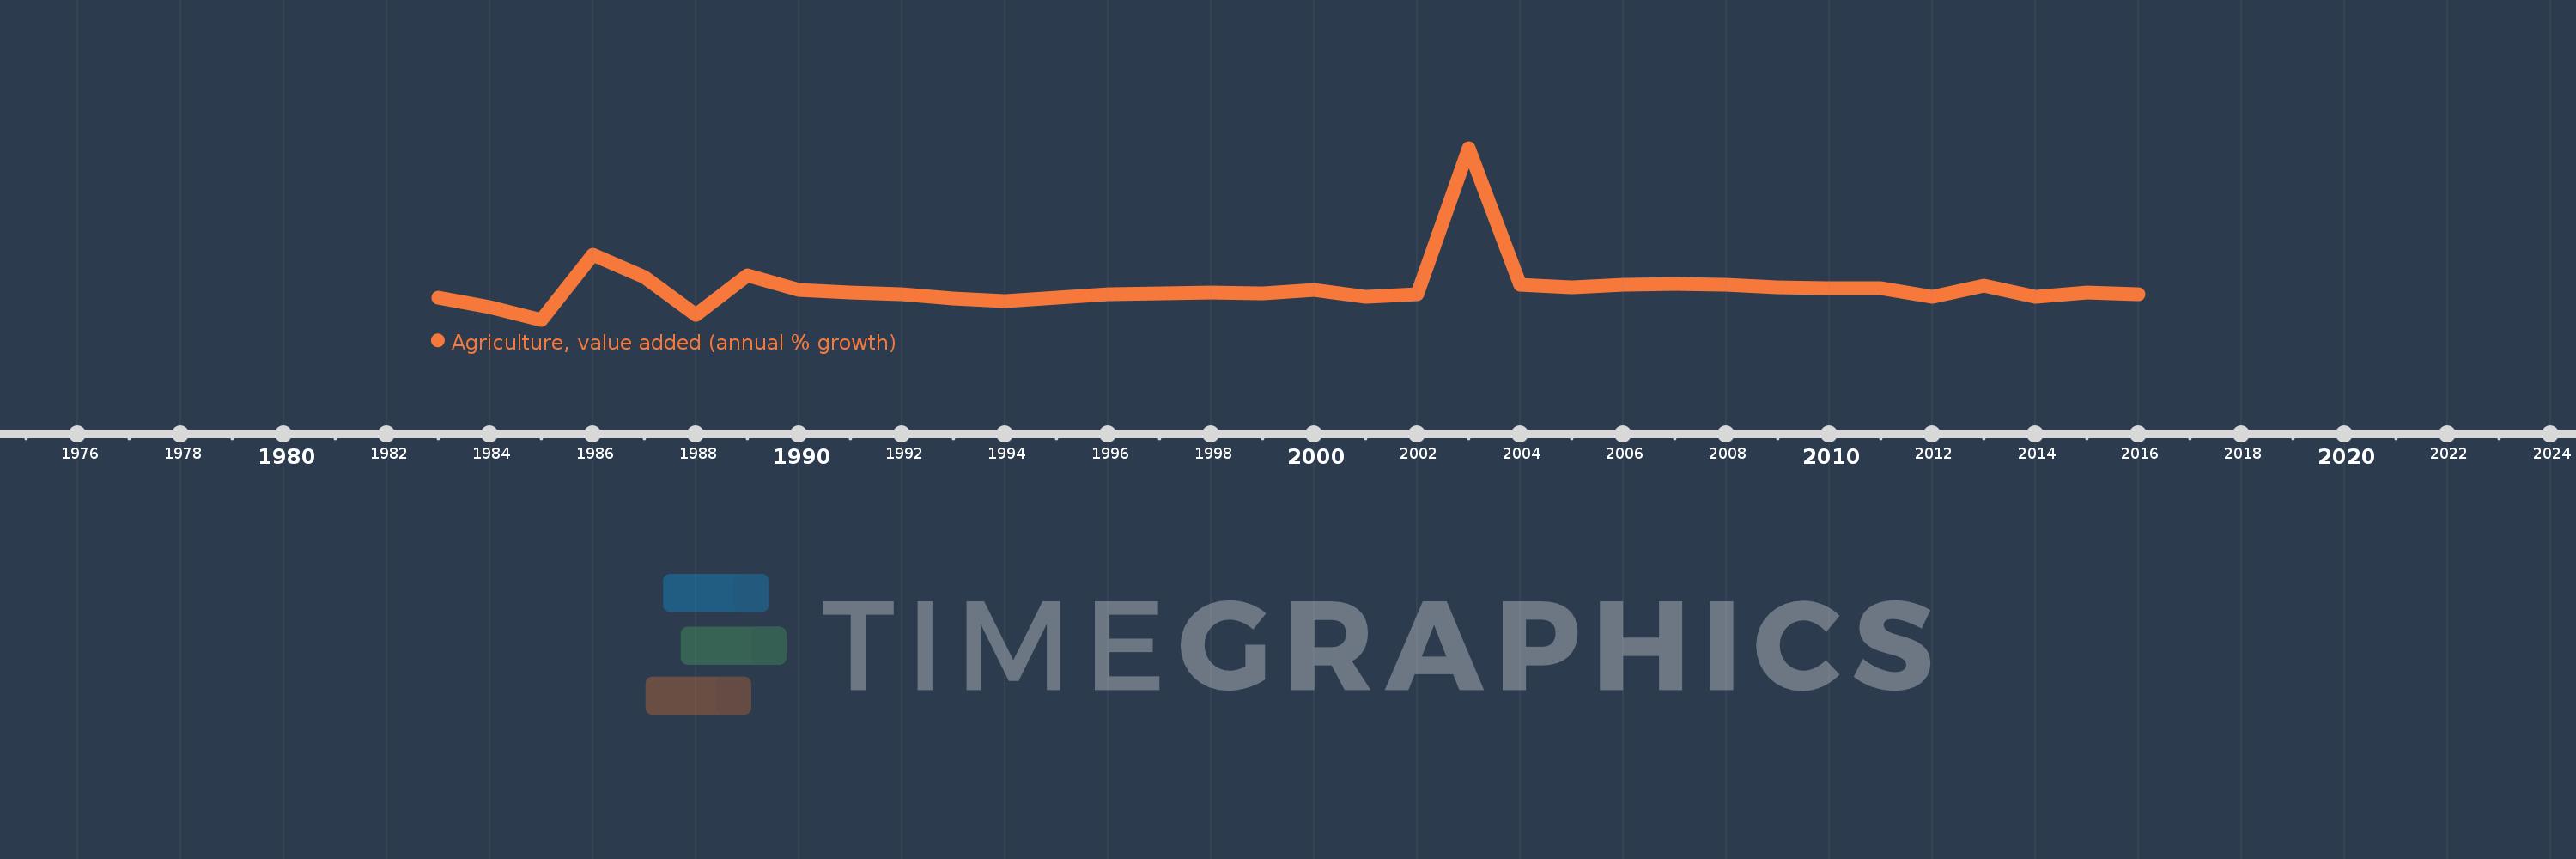
Agriculture, value added (annual % growth)
2016,2015,2014,2013,2012,2011,2010,2009,2008,2007,2006,2005,2004,2003,2002,2001,2000,1999,1998,1997,1996,1995,1994,1993,1992,1991,1990,1989,1988,1987,1986,1985,1984,1983
This statistics in other country:
AfghanistanAlbaniaAlgeriaAntigua and BarbudaArab WorldArgentinaArmeniaAustraliaAustriaAzerbaijanBahamas, TheBahrainBangladeshBelarusBelgiumBelizeBeninBermudaBhutanBoliviaBosnia and HerzegovinaBotswanaBrazilBrunei DarussalamBulgariaBurkina FasoBurundiCabo VerdeCambodiaCameroonCanadaCaribbean small statesCayman IslandsCentral African RepublicCentral Europe and the BalticsChadChileChinaColombiaComorosCongo, Dem. Rep.Congo, Rep.Costa RicaCote d'IvoireCroatiaCubaCyprusCzech RepublicDenmarkDjiboutiDominicaDominican RepublicEarly-demographic dividendEast Asia & PacificEast Asia & Pacific (excluding high income)East Asia & Pacific (IDA & IBRD countries)EcuadorEgypt, Arab Rep.El SalvadorEquatorial GuineaEritreaEstoniaEthiopiaEuro areaEurope & Central AsiaEurope & Central Asia (excluding high income)Europe & Central Asia (IDA & IBRD countries)European UnionFijiFinlandFragile and conflict affected situationsFranceGabonGambia, TheGeorgiaGermanyGhanaGreeceGrenadaGuatemalaGuineaGuinea-BissauGuyanaHaitiHeavily indebted poor countries (HIPC)High incomeHondurasHong Kong SAR, ChinaHungaryIBRD onlyIcelandIDA & IBRD totalIDA blendIDA onlyIDA totalIndiaIndonesiaIran, Islamic Rep.IraqIrelandItalyJamaicaJapanJordanKazakhstanKenyaKiribatiKorea, Rep.KosovoKuwaitKyrgyz RepublicLao PDRLate-demographic dividendLatin America & Caribbean Latin America & Caribbean (excluding high income)Latin America & the Caribbean (IDA & IBRD countries)LatviaLeast developed countries: UN classificationLebanonLesothoLiberiaLithuaniaLow & middle incomeLow incomeLower middle incomeLuxembourgMacedonia, FYRMadagascarMalawiMalaysiaMaldivesMaliMarshall IslandsMauritaniaMauritiusMexicoMicronesia, Fed. Sts.Middle East & North AfricaMiddle East & North Africa (excluding high income)Middle East & North Africa (IDA & IBRD countries)Middle incomeMoldovaMongoliaMontenegroMoroccoMozambiqueMyanmarNamibiaNepalNetherlandsNew ZealandNicaraguaNigerNigeriaNorth AmericaNorwayOECD membersOmanOther small statesPakistanPalauPanamaPapua New GuineaParaguayPeruPhilippinesPolandPortugalPost-demographic dividendPre-demographic dividendPuerto RicoQatarRomaniaRussian FederationRwandaSamoaSao Tome and PrincipeSaudi ArabiaSenegalSerbiaSeychellesSierra LeoneSingaporeSlovak RepublicSloveniaSmall statesSolomon IslandsSomaliaSouth AfricaSouth AsiaSouth Asia (IDA & IBRD)SpainSri LankaSt. Kitts and NevisSt. LuciaSt. Vincent and the GrenadinesSub-Saharan Africa Sub-Saharan Africa (excluding high income)Sub-Saharan Africa (IDA & IBRD countries)SudanSurinameSwazilandSwedenSwitzerlandSyrian Arab RepublicTajikistanTanzaniaThailandTimor-LesteTogoTongaTrinidad and TobagoTunisiaTurkeyTurkmenistanTuvaluUgandaUkraineUnited Arab EmiratesUnited KingdomUnited StatesUpper middle incomeUruguayUzbekistanVanuatuVenezuela, RBVietnamWest Bank and GazaWorldZambiaZimbabwe Timeline:
This timeline shows a graph from 1983 to 2016 of Nigeria. No data until 1982. Number of actual observations by date: 34.
Source name:
World Development Indicators
Source organization:
World Bank national accounts data, and OECD National Accounts data files.
Categories, topics:
Economy & Growth
Last updated:
apr 23, 2017
Indicators value changes by year
Minimum:
-5.239
jan 1, 1985
Maximum:
55.183
jan 1, 2003
At the date of observation
Value
Absolute change
Change from previous value
jan 1, 1983
2.52
+2.52
0.0%
jan 1, 1984
-0.742
-3.262
-129.46%
jan 1, 1985
-5.239
-4.497
605.81%
jan 1, 1986
17.58
+22.819
-435.57%
jan 1, 1987
9.714
-7.866
-44.74%
jan 1, 1988
-3.503
-13.217
-136.07%
jan 1, 1989
10.266
+13.769
-393.02%
jan 1, 1990
5.373
-4.892
-47.66%
jan 1, 1991
4.286
-1.087
-20.23%
jan 1, 1992
3.745
-0.541
-12.62%
jan 1, 1993
2.105
-1.64
-43.8%
jan 1, 1994
1.4
-0.705
-33.48%
jan 1, 1995
2.469
+1.068
76.29%
jan 1, 1996
3.649
+1.181
47.83%
jan 1, 1997
4.152
+0.503
13.79%
jan 1, 1998
4.289
+0.136
3.28%
jan 1, 1999
4.114
-0.174
-4.06%
jan 1, 2000
5.29
+1.176
28.58%
jan 1, 2001
2.945
-2.345
-44.33%
jan 1, 2002
3.881
+0.936
31.77%
jan 1, 2003
55.183
+51.302
1.32K%
jan 1, 2004
6.983
-48.2
-87.35%
jan 1, 2005
6.292
-0.691
-9.89%
jan 1, 2006
7.056
+0.764
12.14%
jan 1, 2007
7.403
+0.347
4.92%
jan 1, 2008
7.192
-0.211
-2.86%
jan 1, 2009
6.266
-0.925
-12.87%
jan 1, 2010
5.879
-0.387
-6.18%
jan 1, 2011
5.823
-0.057
-0.96%
jan 1, 2012
2.916
-2.907
-49.92%
jan 1, 2013
6.704
+3.788
129.92%
jan 1, 2014
2.937
-3.767
-56.2%
jan 1, 2015
4.27
+1.333
45.41%
jan 1, 2016
3.718
-0.552
-12.93%
Ranking of countries by current statistics by years


Comments: