29
/
en
AIzaSyAYiBZKx7MnpbEhh9jyipgxe19OcubqV5w
April 1, 2024
164462
Jordan
JOR
true
2
1
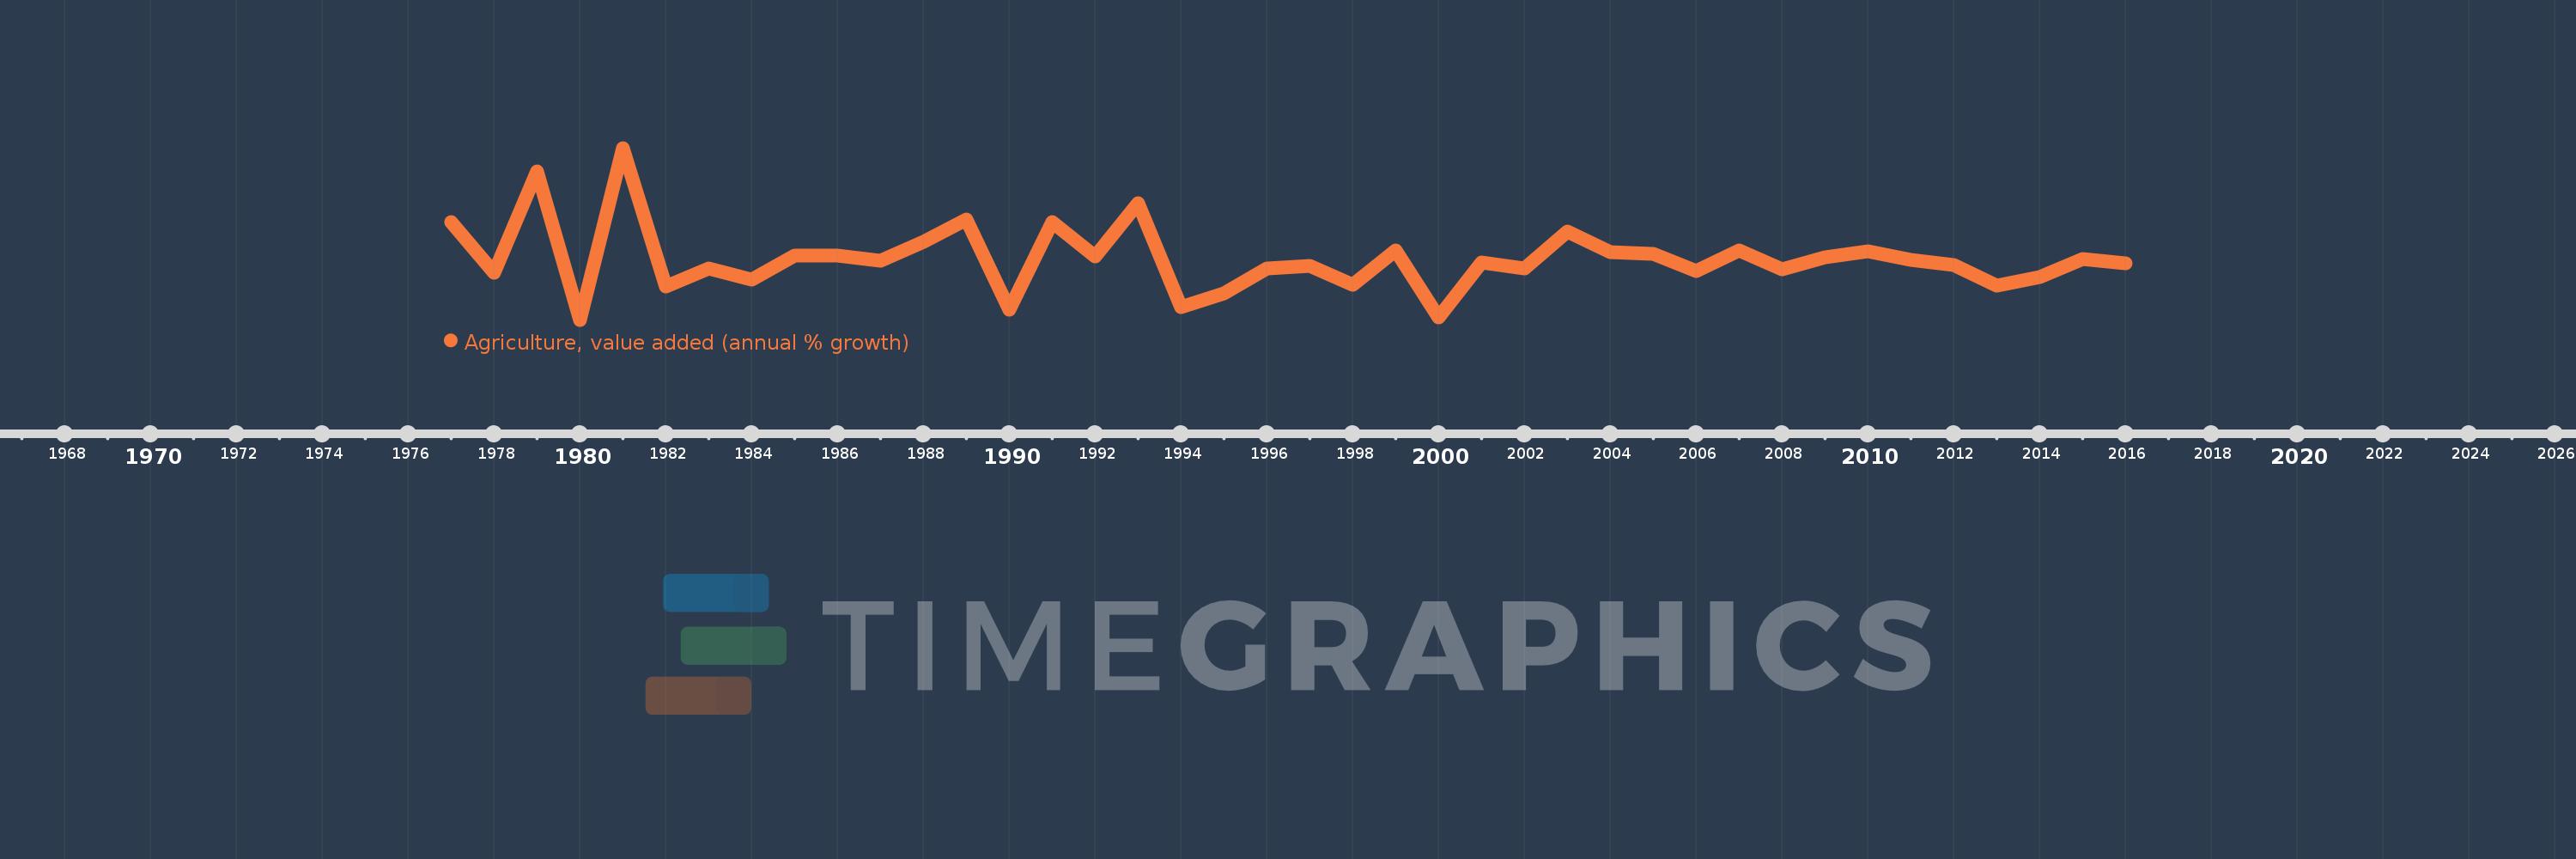
Agriculture, value added (annual % growth)
2016,2015,2014,2013,2012,2011,2010,2009,2008,2007,2006,2005,2004,2003,2002,2001,2000,1999,1998,1997,1996,1995,1994,1993,1992,1991,1990,1989,1988,1987,1986,1985,1984,1983,1982,1981,1980,1979,1978,1977
This statistics in other country:
AfghanistanAlbaniaAlgeriaAntigua and BarbudaArab WorldArgentinaArmeniaAustraliaAustriaAzerbaijanBahamas, TheBahrainBangladeshBelarusBelgiumBelizeBeninBermudaBhutanBoliviaBosnia and HerzegovinaBotswanaBrazilBrunei DarussalamBulgariaBurkina FasoBurundiCabo VerdeCambodiaCameroonCanadaCaribbean small statesCayman IslandsCentral African RepublicCentral Europe and the BalticsChadChileChinaColombiaComorosCongo, Dem. Rep.Congo, Rep.Costa RicaCote d'IvoireCroatiaCubaCyprusCzech RepublicDenmarkDjiboutiDominicaDominican RepublicEarly-demographic dividendEast Asia & PacificEast Asia & Pacific (excluding high income)East Asia & Pacific (IDA & IBRD countries)EcuadorEgypt, Arab Rep.El SalvadorEquatorial GuineaEritreaEstoniaEthiopiaEuro areaEurope & Central AsiaEurope & Central Asia (excluding high income)Europe & Central Asia (IDA & IBRD countries)European UnionFijiFinlandFragile and conflict affected situationsFranceGabonGambia, TheGeorgiaGermanyGhanaGreeceGrenadaGuatemalaGuineaGuinea-BissauGuyanaHaitiHeavily indebted poor countries (HIPC)High incomeHondurasHong Kong SAR, ChinaHungaryIBRD onlyIcelandIDA & IBRD totalIDA blendIDA onlyIDA totalIndiaIndonesiaIran, Islamic Rep.IraqIrelandItalyJamaicaJapanJordanKazakhstanKenyaKiribatiKorea, Rep.KosovoKuwaitKyrgyz RepublicLao PDRLate-demographic dividendLatin America & Caribbean Latin America & Caribbean (excluding high income)Latin America & the Caribbean (IDA & IBRD countries)LatviaLeast developed countries: UN classificationLebanonLesothoLiberiaLithuaniaLow & middle incomeLow incomeLower middle incomeLuxembourgMacedonia, FYRMadagascarMalawiMalaysiaMaldivesMaliMarshall IslandsMauritaniaMauritiusMexicoMicronesia, Fed. Sts.Middle East & North AfricaMiddle East & North Africa (excluding high income)Middle East & North Africa (IDA & IBRD countries)Middle incomeMoldovaMongoliaMontenegroMoroccoMozambiqueMyanmarNamibiaNepalNetherlandsNew ZealandNicaraguaNigerNigeriaNorth AmericaNorwayOECD membersOmanOther small statesPakistanPalauPanamaPapua New GuineaParaguayPeruPhilippinesPolandPortugalPost-demographic dividendPre-demographic dividendPuerto RicoQatarRomaniaRussian FederationRwandaSamoaSao Tome and PrincipeSaudi ArabiaSenegalSerbiaSeychellesSierra LeoneSingaporeSlovak RepublicSloveniaSmall statesSolomon IslandsSomaliaSouth AfricaSouth AsiaSouth Asia (IDA & IBRD)SpainSri LankaSt. Kitts and NevisSt. LuciaSt. Vincent and the GrenadinesSub-Saharan Africa Sub-Saharan Africa (excluding high income)Sub-Saharan Africa (IDA & IBRD countries)SudanSurinameSwazilandSwedenSwitzerlandSyrian Arab RepublicTajikistanTanzaniaThailandTimor-LesteTogoTongaTrinidad and TobagoTunisiaTurkeyTurkmenistanTuvaluUgandaUkraineUnited Arab EmiratesUnited KingdomUnited StatesUpper middle incomeUruguayUzbekistanVanuatuVenezuela, RBVietnamWest Bank and GazaWorldZambiaZimbabwe Timeline:
This timeline shows a graph from 1977 to 2016 of Jordan. No data until 1976. Number of actual observations by date: 40.
Source name:
World Development Indicators
Source organization:
World Bank national accounts data, and OECD National Accounts data files.
Categories, topics:
Economy & Growth
Last updated:
apr 23, 2017
Indicators value changes by year
Minimum:
-30.797
jan 1, 1980
Maximum:
78.011
jan 1, 1981
At the date of observation
Value
Absolute change
Change from previous value
jan 1, 1977
31.154
+31.154
0.0%
jan 1, 1978
-0.88
-32.033
-102.82%
jan 1, 1979
63.314
+64.193
-7.3K%
jan 1, 1980
-30.797
-94.111
-148.64%
jan 1, 1981
78.011
+108.808
-353.3%
jan 1, 1982
-9.706
-87.717
-112.44%
jan 1, 1983
1.792
+11.497
-118.46%
jan 1, 1984
-5.44
-7.231
-403.65%
jan 1, 1985
9.814
+15.254
-280.4%
jan 1, 1986
10.015
+0.202
2.06%
jan 1, 1987
6.504
-3.511
-35.06%
jan 1, 1988
18.511
+12.007
184.62%
jan 1, 1989
32.609
+14.097
76.15%
jan 1, 1990
-24.469
-57.077
-175.04%
jan 1, 1991
31.109
+55.578
-227.14%
jan 1, 1992
9.565
-21.545
-69.25%
jan 1, 1993
43.299
+33.734
352.69%
jan 1, 1994
-22.692
-65.99
-152.41%
jan 1, 1995
-13.962
+8.729
-38.47%
jan 1, 1996
1.646
+15.609
-111.79%
jan 1, 1997
3.488
+1.841
111.84%
jan 1, 1998
-8.488
-11.976
-343.37%
jan 1, 1999
12.992
+21.48
-253.06%
jan 1, 2000
-29.304
-42.296
-325.55%
jan 1, 2001
5.379
+34.683
-118.35%
jan 1, 2002
1.766
-3.612
-67.16%
jan 1, 2003
24.932
+23.166
1.31K%
jan 1, 2004
11.754
-13.178
-52.86%
jan 1, 2005
11.191
-0.563
-4.79%
jan 1, 2006
0.273
-10.918
-97.56%
jan 1, 2007
13.071
+12.799
4.69K%
jan 1, 2008
1.23
-11.841
-90.59%
jan 1, 2009
8.621
+7.391
600.91%
jan 1, 2010
12.83
+4.209
48.83%
jan 1, 2011
6.913
-5.918
-46.12%
jan 1, 2012
3.94
-2.973
-43.0%
jan 1, 2013
-9.351
-13.291
-337.34%
jan 1, 2014
-3.539
+5.812
-62.16%
jan 1, 2015
7.551
+11.09
-313.36%
jan 1, 2016
4.962
-2.589
-34.28%
Ranking of countries by current statistics by years


Comments: