29
/
en
AIzaSyAYiBZKx7MnpbEhh9jyipgxe19OcubqV5w
April 1, 2024
261860
Thailand
THA
true
2
1
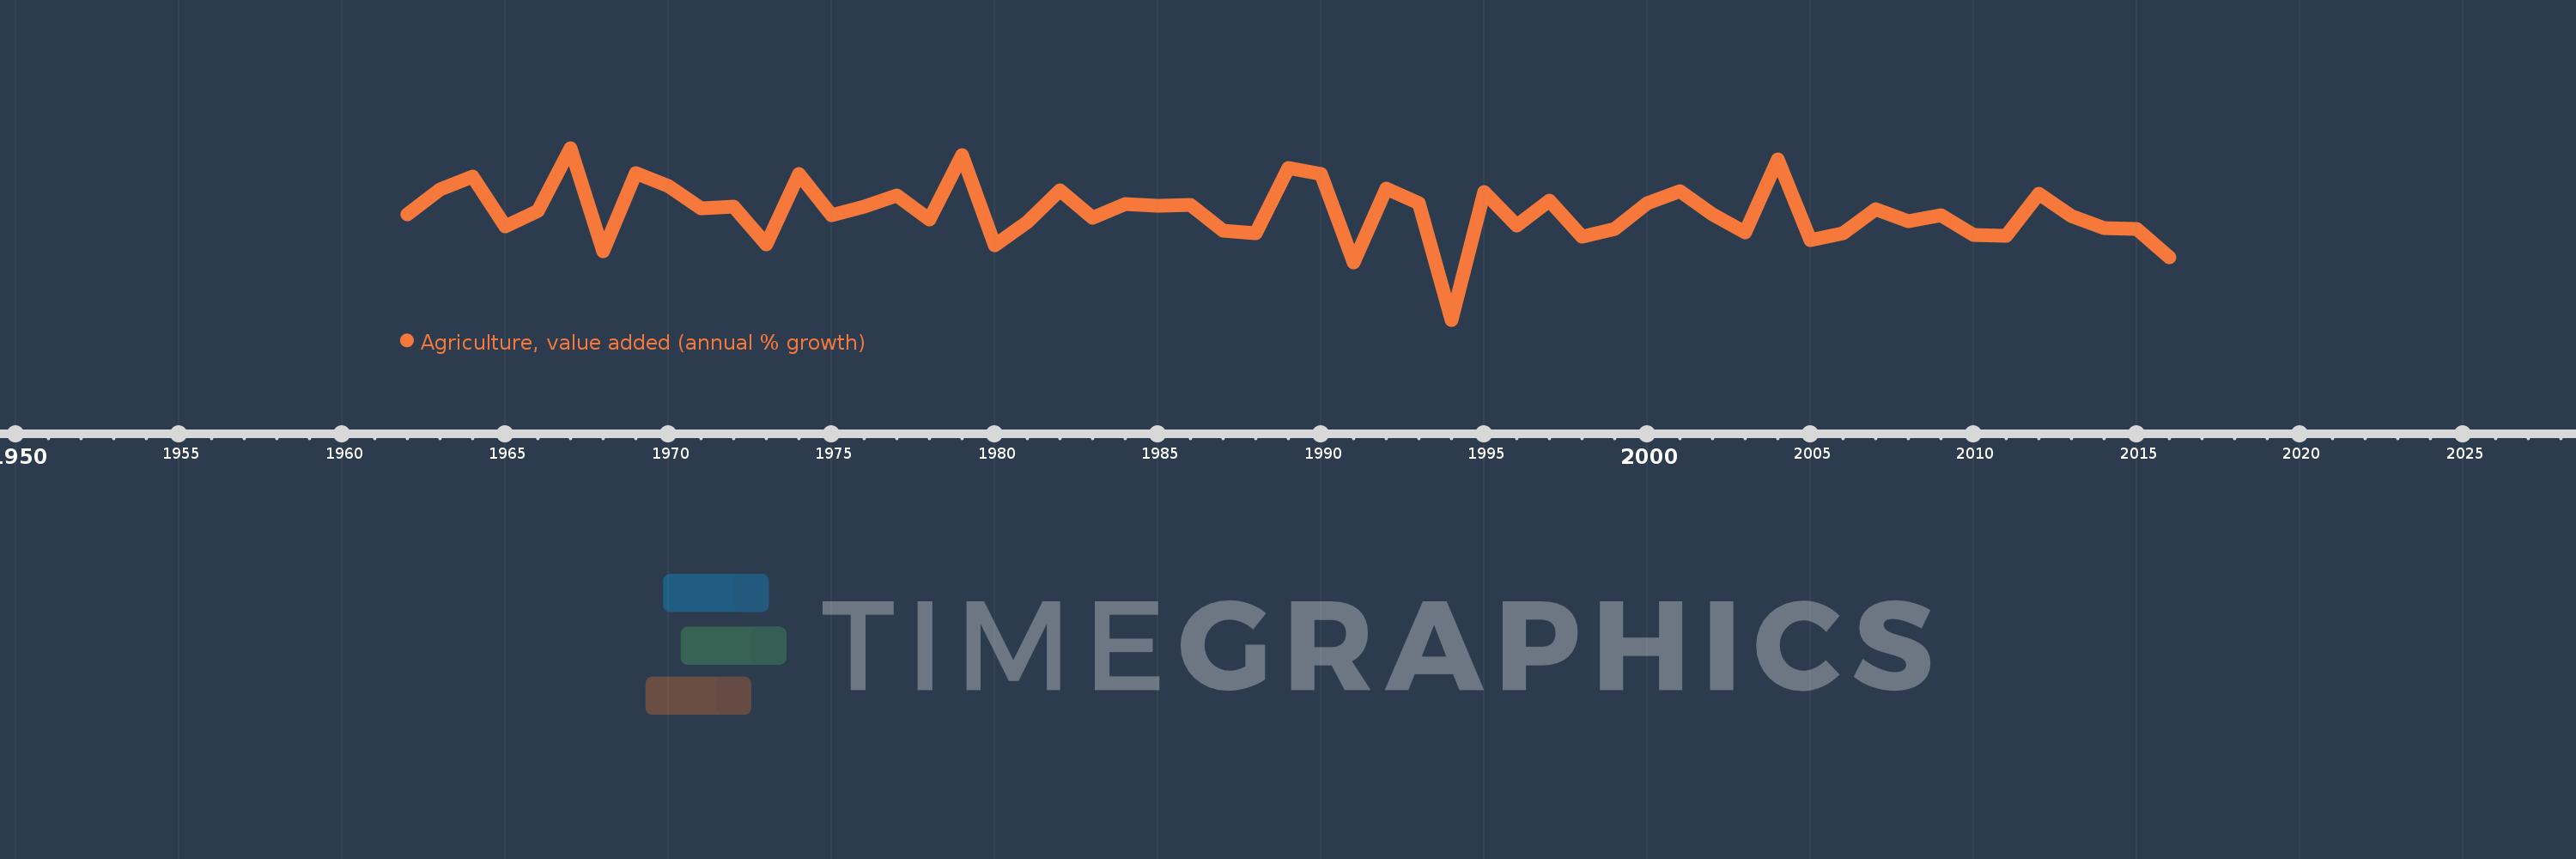
Agriculture, value added (annual % growth)
2016,2015,2014,2013,2012,2011,2010,2009,2008,2007,2006,2005,2004,2003,2002,2001,2000,1999,1998,1997,1996,1995,1994,1993,1992,1991,1990,1989,1988,1987,1986,1985,1984,1983,1982,1981,1980,1979,1978,1977,1976,1975,1974,1973,1972,1971,1970,1969,1968,1967,1966,1965,1964,1963,1962
This statistics in other country:
AfghanistanAlbaniaAlgeriaAntigua and BarbudaArab WorldArgentinaArmeniaAustraliaAustriaAzerbaijanBahamas, TheBahrainBangladeshBelarusBelgiumBelizeBeninBermudaBhutanBoliviaBosnia and HerzegovinaBotswanaBrazilBrunei DarussalamBulgariaBurkina FasoBurundiCabo VerdeCambodiaCameroonCanadaCaribbean small statesCayman IslandsCentral African RepublicCentral Europe and the BalticsChadChileChinaColombiaComorosCongo, Dem. Rep.Congo, Rep.Costa RicaCote d'IvoireCroatiaCubaCyprusCzech RepublicDenmarkDjiboutiDominicaDominican RepublicEarly-demographic dividendEast Asia & PacificEast Asia & Pacific (excluding high income)East Asia & Pacific (IDA & IBRD countries)EcuadorEgypt, Arab Rep.El SalvadorEquatorial GuineaEritreaEstoniaEthiopiaEuro areaEurope & Central AsiaEurope & Central Asia (excluding high income)Europe & Central Asia (IDA & IBRD countries)European UnionFijiFinlandFragile and conflict affected situationsFranceGabonGambia, TheGeorgiaGermanyGhanaGreeceGrenadaGuatemalaGuineaGuinea-BissauGuyanaHaitiHeavily indebted poor countries (HIPC)High incomeHondurasHong Kong SAR, ChinaHungaryIBRD onlyIcelandIDA & IBRD totalIDA blendIDA onlyIDA totalIndiaIndonesiaIran, Islamic Rep.IraqIrelandItalyJamaicaJapanJordanKazakhstanKenyaKiribatiKorea, Rep.KosovoKuwaitKyrgyz RepublicLao PDRLate-demographic dividendLatin America & Caribbean Latin America & Caribbean (excluding high income)Latin America & the Caribbean (IDA & IBRD countries)LatviaLeast developed countries: UN classificationLebanonLesothoLiberiaLithuaniaLow & middle incomeLow incomeLower middle incomeLuxembourgMacedonia, FYRMadagascarMalawiMalaysiaMaldivesMaliMarshall IslandsMauritaniaMauritiusMexicoMicronesia, Fed. Sts.Middle East & North AfricaMiddle East & North Africa (excluding high income)Middle East & North Africa (IDA & IBRD countries)Middle incomeMoldovaMongoliaMontenegroMoroccoMozambiqueMyanmarNamibiaNepalNetherlandsNew ZealandNicaraguaNigerNigeriaNorth AmericaNorwayOECD membersOmanOther small statesPakistanPalauPanamaPapua New GuineaParaguayPeruPhilippinesPolandPortugalPost-demographic dividendPre-demographic dividendPuerto RicoQatarRomaniaRussian FederationRwandaSamoaSao Tome and PrincipeSaudi ArabiaSenegalSerbiaSeychellesSierra LeoneSingaporeSlovak RepublicSloveniaSmall statesSolomon IslandsSomaliaSouth AfricaSouth AsiaSouth Asia (IDA & IBRD)SpainSri LankaSt. Kitts and NevisSt. LuciaSt. Vincent and the GrenadinesSub-Saharan Africa Sub-Saharan Africa (excluding high income)Sub-Saharan Africa (IDA & IBRD countries)SudanSurinameSwazilandSwedenSwitzerlandSyrian Arab RepublicTajikistanTanzaniaThailandTimor-LesteTogoTongaTrinidad and TobagoTunisiaTurkeyTurkmenistanTuvaluUgandaUkraineUnited Arab EmiratesUnited KingdomUnited StatesUpper middle incomeUruguayUzbekistanVanuatuVenezuela, RBVietnamWest Bank and GazaWorldZambiaZimbabwe Timeline:
This timeline shows a graph from 1962 to 2016 of Thailand. No data until 1961. Number of actual observations by date: 55.
Source name:
World Development Indicators
Source organization:
World Bank national accounts data, and OECD National Accounts data files.
Categories, topics:
Economy & Growth
Last updated:
apr 23, 2017
Indicators value changes by year
Minimum:
-13.896
jan 1, 1994
Maximum:
13.725
jan 1, 1967
At the date of observation
Value
Absolute change
Change from previous value
jan 1, 1962
3.016
+3.016
0.0%
jan 1, 1963
7.115
+4.099
135.93%
jan 1, 1964
9.153
+2.038
28.64%
jan 1, 1965
1.098
-8.055
-88.01%
jan 1, 1966
3.595
+2.497
227.42%
jan 1, 1967
13.725
+10.13
281.82%
jan 1, 1968
-2.955
-16.68
-121.53%
jan 1, 1969
9.645
+12.6
-426.39%
jan 1, 1970
7.638
-2.007
-20.81%
jan 1, 1971
3.96
-3.678
-48.15%
jan 1, 1972
4.276
+0.316
7.97%
jan 1, 1973
-1.823
-6.099
-142.63%
jan 1, 1974
9.513
+11.335
-621.89%
jan 1, 1975
2.967
-6.546
-68.81%
jan 1, 1976
4.321
+1.354
45.65%
jan 1, 1977
6.114
+1.793
41.5%
jan 1, 1978
2.231
-3.884
-63.52%
jan 1, 1979
12.545
+10.315
462.41%
jan 1, 1980
-1.939
-14.484
-115.45%
jan 1, 1981
1.812
+3.751
-193.47%
jan 1, 1982
6.855
+5.043
278.26%
jan 1, 1983
2.475
-4.38
-63.9%
jan 1, 1984
4.772
+2.297
92.79%
jan 1, 1985
4.419
-0.352
-7.38%
jan 1, 1986
4.508
+0.089
2.01%
jan 1, 1987
0.381
-4.127
-91.54%
jan 1, 1988
0.068
-0.313
-82.19%
jan 1, 1989
10.51
+10.442
15.37K%
jan 1, 1990
9.599
-0.911
-8.67%
jan 1, 1991
-4.687
-14.286
-148.82%
jan 1, 1992
7.258
+11.945
-254.87%
jan 1, 1993
4.788
-2.47
-34.04%
jan 1, 1994
-13.896
-18.684
-390.24%
jan 1, 1995
6.663
+20.559
-147.95%
jan 1, 1996
1.282
-5.382
-80.76%
jan 1, 1997
5.292
+4.011
312.89%
jan 1, 1998
-0.478
-5.77
-109.03%
jan 1, 1999
0.697
+1.175
-245.8%
jan 1, 2000
4.822
+4.125
591.92%
jan 1, 2001
6.801
+1.979
41.04%
jan 1, 2002
3.084
-3.716
-54.65%
jan 1, 2003
0.124
-2.961
-95.99%
jan 1, 2004
11.945
+11.821
9.57K%
jan 1, 2005
-1.111
-13.056
-109.3%
jan 1, 2006
-0.051
+1.06
-95.38%
jan 1, 2007
3.931
+3.983
-7.76K%
jan 1, 2008
1.896
-2.036
-51.78%
jan 1, 2009
2.933
+1.037
54.71%
jan 1, 2010
-0.242
-3.175
-108.26%
jan 1, 2011
-0.457
-0.215
88.92%
jan 1, 2012
6.295
+6.753
-1.48K%
jan 1, 2013
2.706
-3.589
-57.01%
jan 1, 2014
0.806
-1.9
-70.21%
jan 1, 2015
0.677
-0.129
-15.99%
jan 1, 2016
-3.809
-4.486
-662.41%
Ranking of countries by current statistics by years


Comments: