29
/
en
AIzaSyAYiBZKx7MnpbEhh9jyipgxe19OcubqV5w
April 1, 2024
189867
Mali
MLI
true
2
1
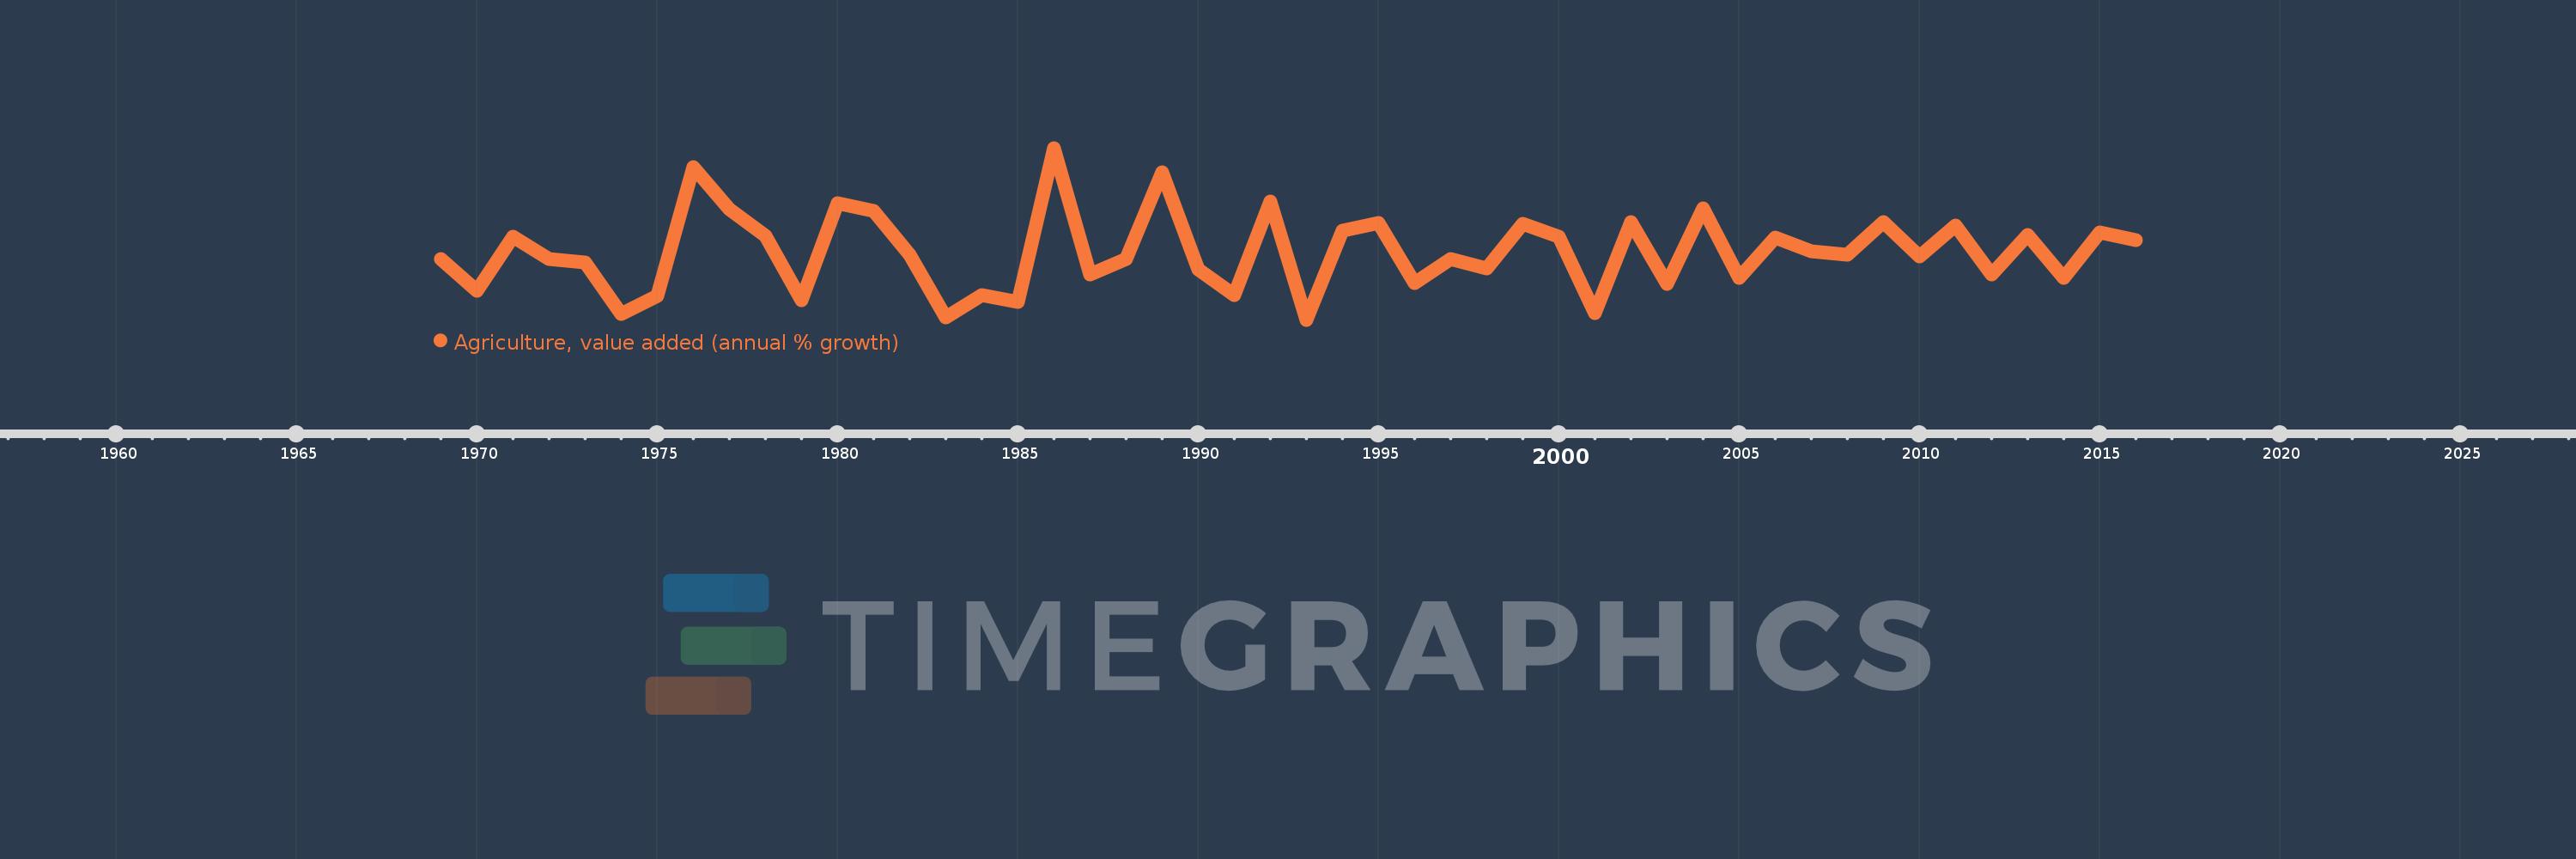
Agriculture, value added (annual % growth)
2016,2015,2014,2013,2012,2011,2010,2009,2008,2007,2006,2005,2004,2003,2002,2001,2000,1999,1998,1997,1996,1995,1994,1993,1992,1991,1990,1989,1988,1987,1986,1985,1984,1983,1982,1981,1980,1979,1978,1977,1976,1975,1974,1973,1972,1971,1970,1969
This statistics in other country:
AfghanistanAlbaniaAlgeriaAntigua and BarbudaArab WorldArgentinaArmeniaAustraliaAustriaAzerbaijanBahamas, TheBahrainBangladeshBelarusBelgiumBelizeBeninBermudaBhutanBoliviaBosnia and HerzegovinaBotswanaBrazilBrunei DarussalamBulgariaBurkina FasoBurundiCabo VerdeCambodiaCameroonCanadaCaribbean small statesCayman IslandsCentral African RepublicCentral Europe and the BalticsChadChileChinaColombiaComorosCongo, Dem. Rep.Congo, Rep.Costa RicaCote d'IvoireCroatiaCubaCyprusCzech RepublicDenmarkDjiboutiDominicaDominican RepublicEarly-demographic dividendEast Asia & PacificEast Asia & Pacific (excluding high income)East Asia & Pacific (IDA & IBRD countries)EcuadorEgypt, Arab Rep.El SalvadorEquatorial GuineaEritreaEstoniaEthiopiaEuro areaEurope & Central AsiaEurope & Central Asia (excluding high income)Europe & Central Asia (IDA & IBRD countries)European UnionFijiFinlandFragile and conflict affected situationsFranceGabonGambia, TheGeorgiaGermanyGhanaGreeceGrenadaGuatemalaGuineaGuinea-BissauGuyanaHaitiHeavily indebted poor countries (HIPC)High incomeHondurasHong Kong SAR, ChinaHungaryIBRD onlyIcelandIDA & IBRD totalIDA blendIDA onlyIDA totalIndiaIndonesiaIran, Islamic Rep.IraqIrelandItalyJamaicaJapanJordanKazakhstanKenyaKiribatiKorea, Rep.KosovoKuwaitKyrgyz RepublicLao PDRLate-demographic dividendLatin America & Caribbean Latin America & Caribbean (excluding high income)Latin America & the Caribbean (IDA & IBRD countries)LatviaLeast developed countries: UN classificationLebanonLesothoLiberiaLithuaniaLow & middle incomeLow incomeLower middle incomeLuxembourgMacedonia, FYRMadagascarMalawiMalaysiaMaldivesMaliMarshall IslandsMauritaniaMauritiusMexicoMicronesia, Fed. Sts.Middle East & North AfricaMiddle East & North Africa (excluding high income)Middle East & North Africa (IDA & IBRD countries)Middle incomeMoldovaMongoliaMontenegroMoroccoMozambiqueMyanmarNamibiaNepalNetherlandsNew ZealandNicaraguaNigerNigeriaNorth AmericaNorwayOECD membersOmanOther small statesPakistanPalauPanamaPapua New GuineaParaguayPeruPhilippinesPolandPortugalPost-demographic dividendPre-demographic dividendPuerto RicoQatarRomaniaRussian FederationRwandaSamoaSao Tome and PrincipeSaudi ArabiaSenegalSerbiaSeychellesSierra LeoneSingaporeSlovak RepublicSloveniaSmall statesSolomon IslandsSomaliaSouth AfricaSouth AsiaSouth Asia (IDA & IBRD)SpainSri LankaSt. Kitts and NevisSt. LuciaSt. Vincent and the GrenadinesSub-Saharan Africa Sub-Saharan Africa (excluding high income)Sub-Saharan Africa (IDA & IBRD countries)SudanSurinameSwazilandSwedenSwitzerlandSyrian Arab RepublicTajikistanTanzaniaThailandTimor-LesteTogoTongaTrinidad and TobagoTunisiaTurkeyTurkmenistanTuvaluUgandaUkraineUnited Arab EmiratesUnited KingdomUnited StatesUpper middle incomeUruguayUzbekistanVanuatuVenezuela, RBVietnamWest Bank and GazaWorldZambiaZimbabwe Timeline:
This timeline shows a graph from 1969 to 2016 of Mali. No data until 1968. Number of actual observations by date: 48.
Source name:
World Development Indicators
Source organization:
World Bank national accounts data, and OECD National Accounts data files.
Categories, topics:
Economy & Growth
Last updated:
apr 23, 2017
Indicators value changes by year
Minimum:
-12.281
jan 1, 1993
Maximum:
29.257
jan 1, 1986
At the date of observation
Value
Absolute change
Change from previous value
jan 1, 1969
2.439
+2.439
0.0%
jan 1, 1970
-5.292
-7.731
-316.95%
jan 1, 1971
7.822
+13.114
-247.81%
jan 1, 1972
2.331
-5.491
-70.2%
jan 1, 1973
1.519
-0.812
-34.82%
jan 1, 1974
-10.972
-12.492
-822.18%
jan 1, 1975
-6.443
+4.529
-41.28%
jan 1, 1976
24.551
+30.994
-481.03%
jan 1, 1977
14.423
-10.128
-41.25%
jan 1, 1978
7.984
-6.439
-44.65%
jan 1, 1979
-7.587
-15.571
-195.03%
jan 1, 1980
15.999
+23.586
-310.88%
jan 1, 1981
14.086
-1.914
-11.96%
jan 1, 1982
3.538
-10.547
-74.88%
jan 1, 1983
-11.657
-15.195
-429.43%
jan 1, 1984
-6.355
+5.302
-45.48%
jan 1, 1985
-8.017
-1.662
26.16%
jan 1, 1986
29.257
+37.275
-464.92%
jan 1, 1987
-1.355
-30.612
-104.63%
jan 1, 1988
2.444
+3.799
-280.35%
jan 1, 1989
23.367
+20.924
856.26%
jan 1, 1990
-0.05
-23.417
-100.21%
jan 1, 1991
-6.398
-6.348
12.73K%
jan 1, 1992
16.296
+22.694
-354.69%
jan 1, 1993
-12.281
-28.577
-175.36%
jan 1, 1994
9.23
+21.51
-175.15%
jan 1, 1995
11.031
+1.802
19.52%
jan 1, 1996
-3.37
-14.401
-130.55%
jan 1, 1997
2.33
+5.7
-169.14%
jan 1, 1998
0.156
-2.174
-93.3%
jan 1, 1999
10.936
+10.78
6.91K%
jan 1, 2000
7.736
-3.199
-29.26%
jan 1, 2001
-10.685
-18.422
-238.12%
jan 1, 2002
11.385
+22.071
-206.55%
jan 1, 2003
-3.7
-15.085
-132.5%
jan 1, 2004
14.559
+18.259
-493.48%
jan 1, 2005
-2.257
-16.816
-115.51%
jan 1, 2006
7.572
+9.829
-435.42%
jan 1, 2007
4.181
-3.391
-44.78%
jan 1, 2008
3.361
-0.821
-19.63%
jan 1, 2009
11.417
+8.056
239.73%
jan 1, 2010
3.12
-8.297
-72.67%
jan 1, 2011
10.451
+7.331
234.94%
jan 1, 2012
-1.339
-11.79
-112.82%
jan 1, 2013
8.179
+9.519
-710.66%
jan 1, 2014
-2.138
-10.317
-126.13%
jan 1, 2015
8.75
+10.888
-509.33%
jan 1, 2016
6.924
-1.826
-20.87%
Ranking of countries by current statistics by years


Comments: