29
/
en
AIzaSyAYiBZKx7MnpbEhh9jyipgxe19OcubqV5w
April 1, 2024
84864
Benin
BEN
true
2
1
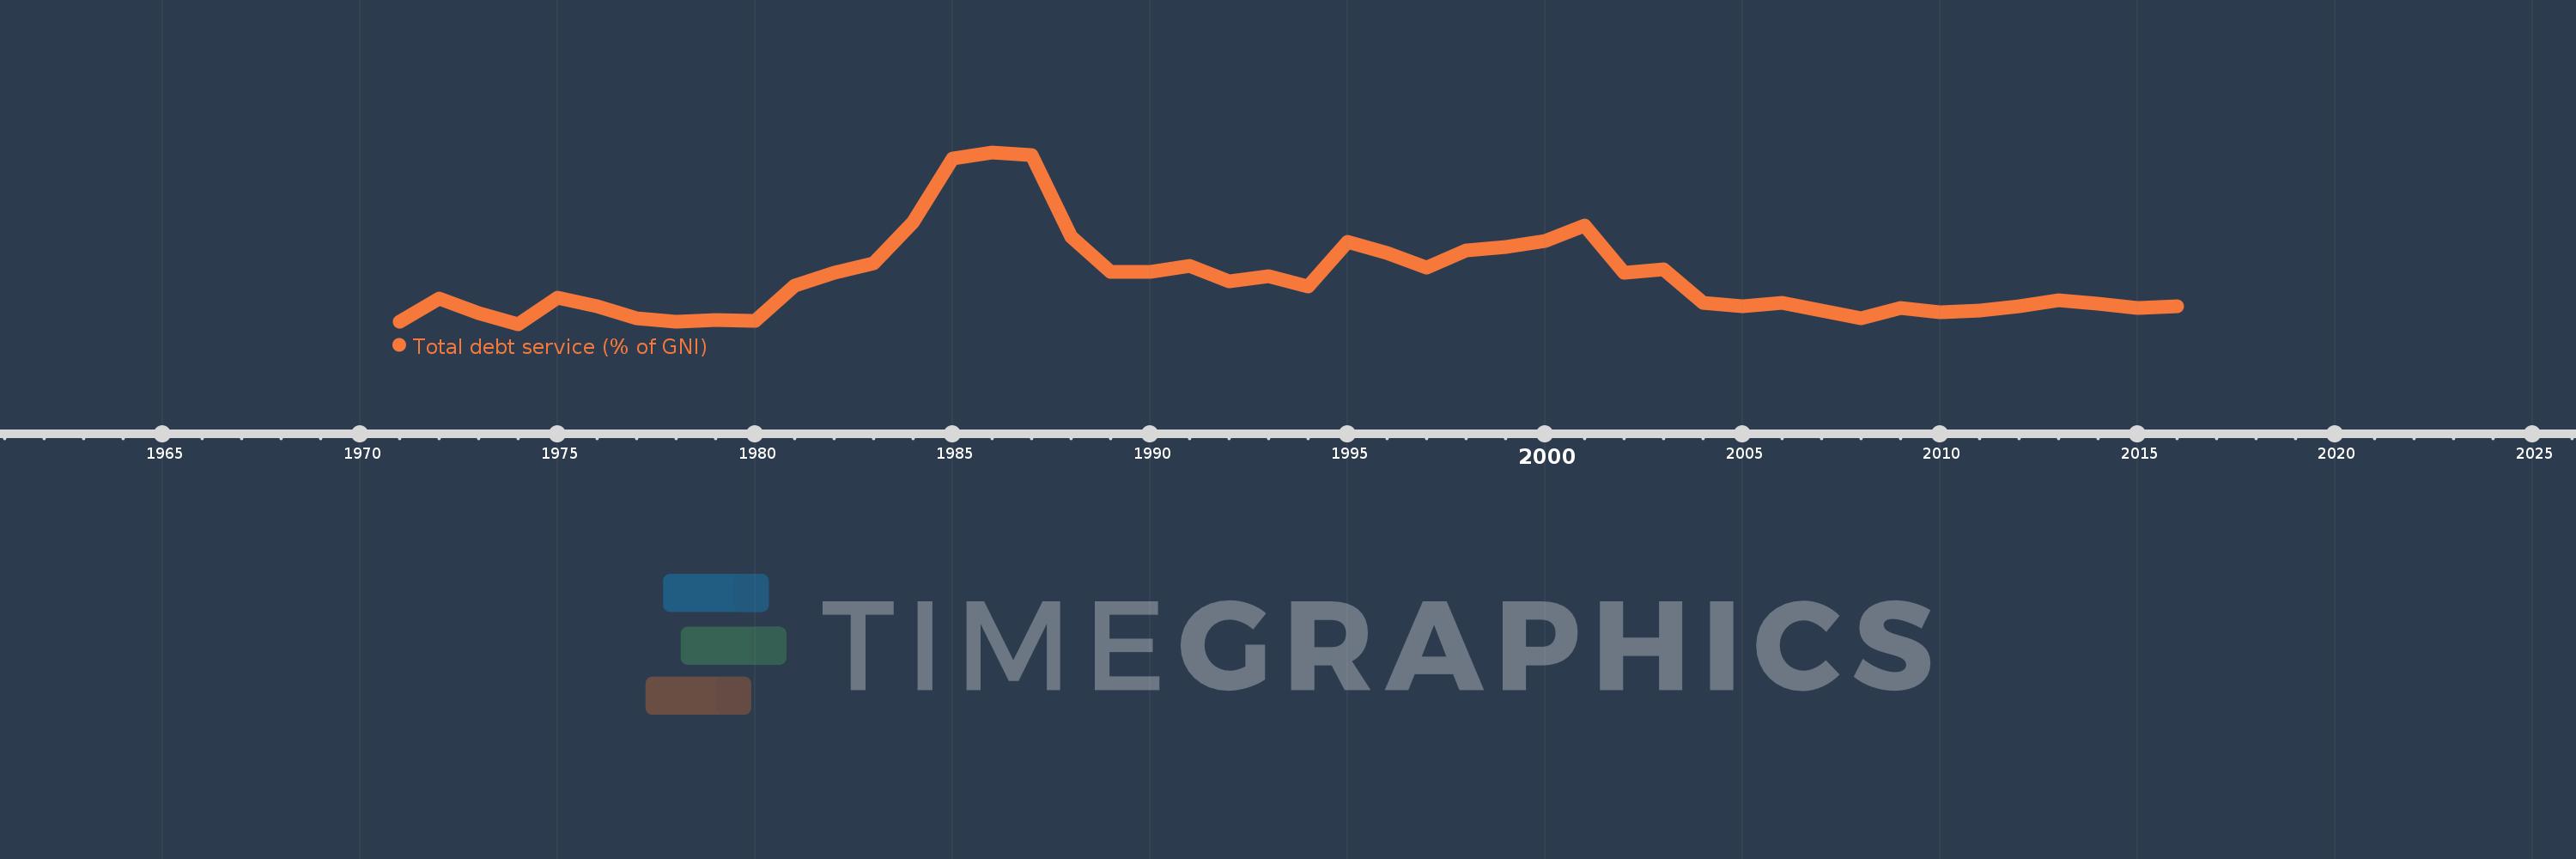
Total debt service (% of GNI)
2016,2015,2014,2013,2012,2011,2010,2009,2008,2007,2006,2005,2004,2003,2002,2001,2000,1999,1998,1997,1996,1995,1994,1993,1992,1991,1990,1989,1988,1987,1986,1985,1984,1983,1982,1981,1980,1979,1978,1977,1976,1975,1974,1973,1972,1971
This statistics in other country:
Timeline:
This timeline shows a graph from 1971 to 2016 of Benin. No data until 1970. Number of actual observations by date: 46.
Source name:
World Development Indicators
Source organization:
World Bank, International Debt Statistics.
Categories, topics:
Economy & Growth, External Debt
Last updated:
apr 23, 2017
Indicators value changes by year
At the date of observation
Value
Absolute change
Change from previous value
jan 1, 1971
0.526
+0.526
0.0%
jan 1, 1972
1.107
+0.581
110.43%
jan 1, 1973
0.729
-0.378
-34.1%
jan 1, 1974
0.458
-0.271
-37.16%
jan 1, 1975
1.12
+0.661
144.26%
jan 1, 1976
0.901
-0.218
-19.5%
jan 1, 1977
0.615
-0.286
-31.72%
jan 1, 1978
0.517
-0.098
-15.94%
jan 1, 1979
0.558
+0.041
7.92%
jan 1, 1980
0.549
-0.009
-1.6%
jan 1, 1981
1.439
+0.89
162.01%
jan 1, 1982
1.755
+0.316
21.97%
jan 1, 1983
1.987
+0.231
13.16%
jan 1, 1984
3.046
+1.059
53.31%
jan 1, 1985
4.639
+1.593
52.3%
jan 1, 1986
4.798
+0.159
3.44%
jan 1, 1987
4.725
-0.073
-1.53%
jan 1, 1988
2.66
-2.065
-43.7%
jan 1, 1989
1.774
-0.886
-33.31%
jan 1, 1990
1.769
-0.005
-0.28%
jan 1, 1991
1.931
+0.162
9.16%
jan 1, 1992
1.547
-0.384
-19.89%
jan 1, 1993
1.68
+0.133
8.57%
jan 1, 1994
1.409
-0.271
-16.12%
jan 1, 1995
2.533
+1.124
79.77%
jan 1, 1996
2.255
-0.278
-10.98%
jan 1, 1997
1.886
-0.369
-16.35%
jan 1, 1998
2.314
+0.428
22.7%
jan 1, 1999
2.399
+0.085
3.68%
jan 1, 2000
2.571
+0.171
7.14%
jan 1, 2001
2.945
+0.374
14.56%
jan 1, 2002
1.763
-1.182
-40.14%
jan 1, 2003
1.845
+0.082
4.67%
jan 1, 2004
0.997
-0.848
-45.95%
jan 1, 2005
0.906
-0.091
-9.16%
jan 1, 2006
1.0
+0.094
10.42%
jan 1, 2007
0.811
-0.19
-18.97%
jan 1, 2008
0.609
-0.201
-24.84%
jan 1, 2009
0.876
+0.267
43.82%
jan 1, 2010
0.75
-0.127
-14.45%
jan 1, 2011
0.813
+0.063
8.45%
jan 1, 2012
0.909
+0.096
11.78%
jan 1, 2013
1.053
+0.144
15.86%
jan 1, 2014
0.977
-0.075
-7.16%
jan 1, 2015
0.869
-0.108
-11.07%
jan 1, 2016
0.914
+0.045
5.16%
Ranking of countries by current statistics by years


Comments: