29
/
en
AIzaSyAYiBZKx7MnpbEhh9jyipgxe19OcubqV5w
April 1, 2024
224401
Philippines
PHL
true
2
1
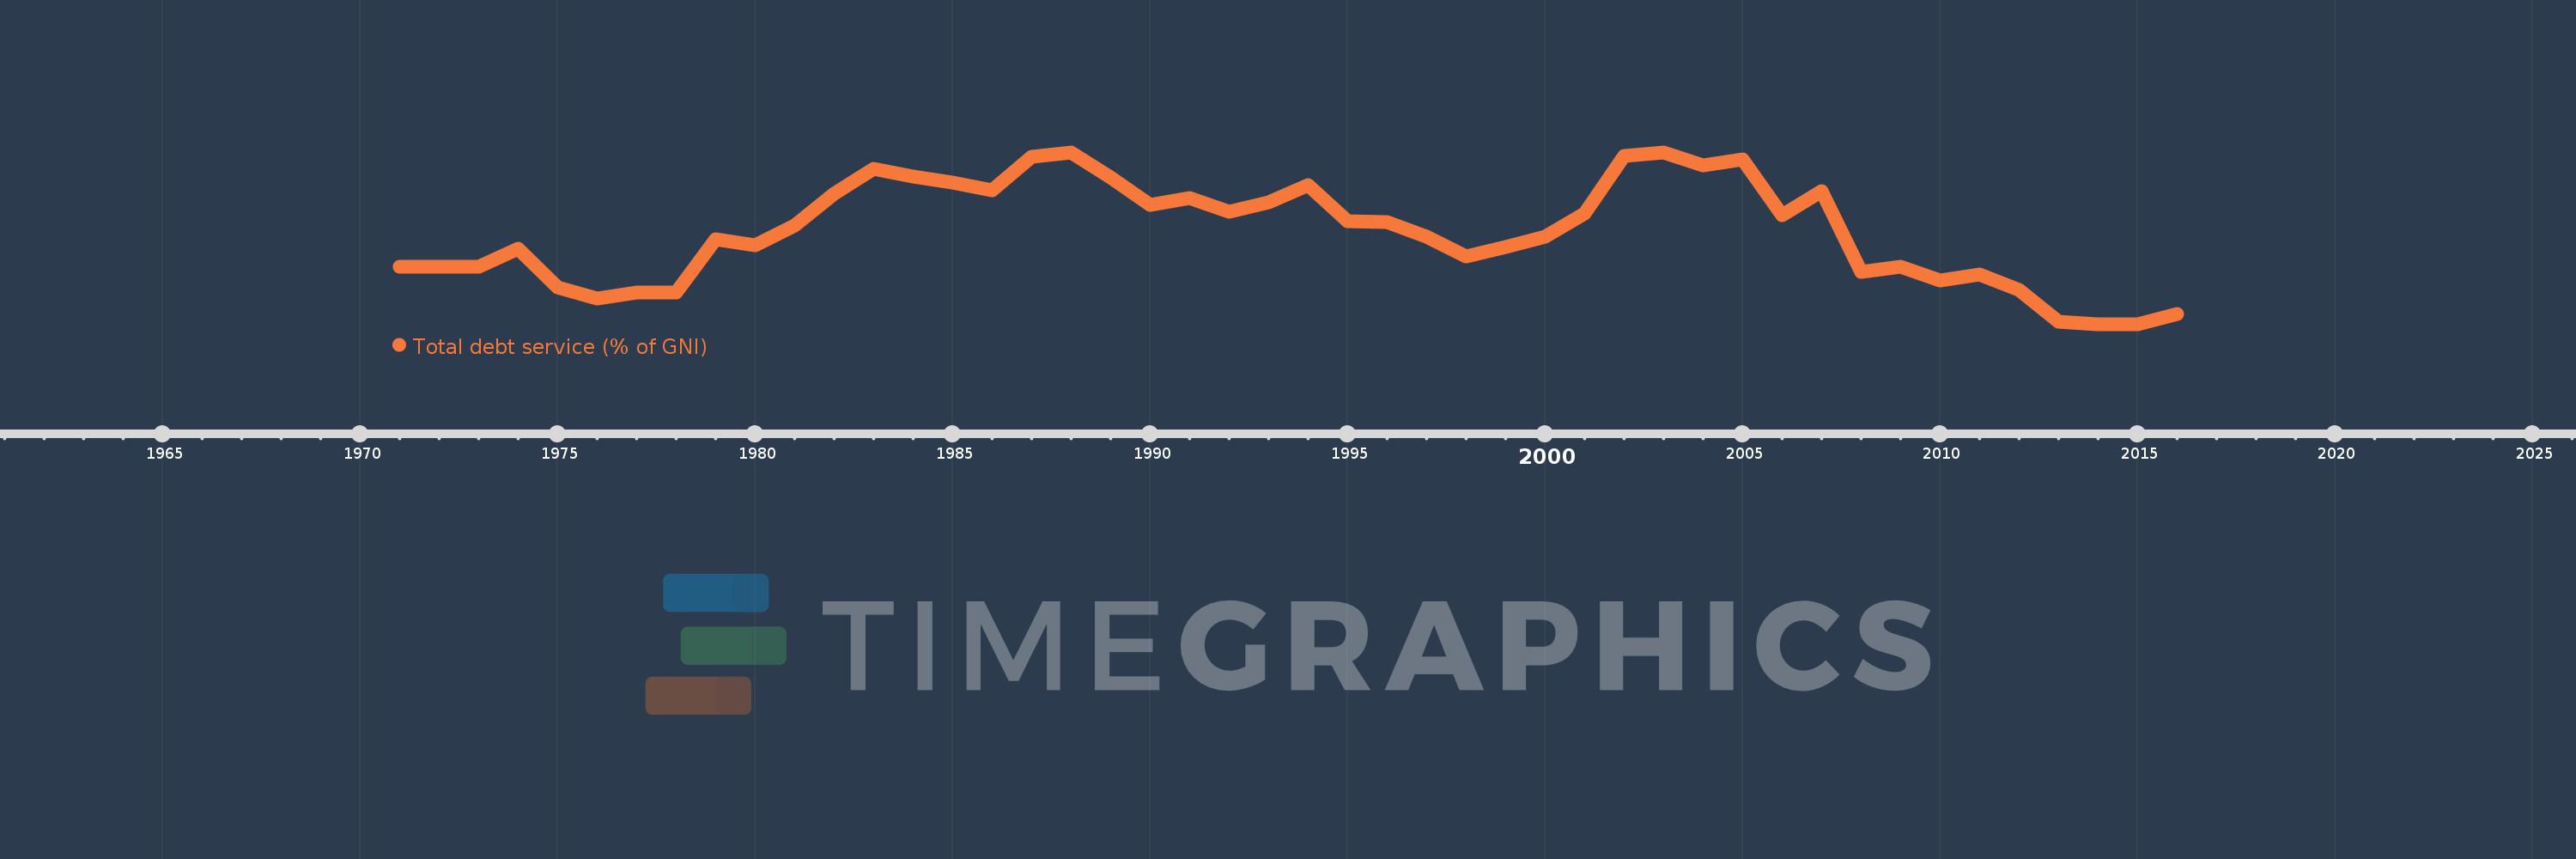
Total debt service (% of GNI)
2016,2015,2014,2013,2012,2011,2010,2009,2008,2007,2006,2005,2004,2003,2002,2001,2000,1999,1998,1997,1996,1995,1994,1993,1992,1991,1990,1989,1988,1987,1986,1985,1984,1983,1982,1981,1980,1979,1978,1977,1976,1975,1974,1973,1972,1971
This statistics in other country:
Timeline:
This timeline shows a graph from 1971 to 2016 of Philippines. No data until 1970. Number of actual observations by date: 46.
Source name:
World Development Indicators
Source organization:
World Bank, International Debt Statistics.
Categories, topics:
Economy & Growth, External Debt
Last updated:
apr 23, 2017
Indicators value changes by year
Maximum:
10.576
jan 1, 2003
At the date of observation
Value
Absolute change
Change from previous value
jan 1, 1971
4.696
+4.696
0.0%
jan 1, 1972
4.699
+0.003
0.05%
jan 1, 1973
4.709
+0.011
0.22%
jan 1, 1974
5.649
+0.94
19.96%
jan 1, 1975
3.65
-1.999
-35.39%
jan 1, 1976
3.094
-0.556
-15.23%
jan 1, 1977
3.392
+0.298
9.63%
jan 1, 1978
3.401
+0.009
0.26%
jan 1, 1979
6.12
+2.719
79.94%
jan 1, 1980
5.806
-0.314
-5.13%
jan 1, 1981
6.818
+1.012
17.43%
jan 1, 1982
8.458
+1.64
24.06%
jan 1, 1983
9.733
+1.275
15.07%
jan 1, 1984
9.359
-0.374
-3.85%
jan 1, 1985
9.031
-0.328
-3.5%
jan 1, 1986
8.615
-0.416
-4.61%
jan 1, 1987
10.373
+1.758
20.41%
jan 1, 1988
10.559
+0.186
1.79%
jan 1, 1989
9.285
-1.274
-12.07%
jan 1, 1990
7.896
-1.388
-14.95%
jan 1, 1991
8.24
+0.344
4.35%
jan 1, 1992
7.517
-0.723
-8.78%
jan 1, 1993
8.036
+0.52
6.92%
jan 1, 1994
8.898
+0.861
10.72%
jan 1, 1995
7.045
-1.853
-20.82%
jan 1, 1996
7.016
-0.029
-0.42%
jan 1, 1997
6.236
-0.78
-11.12%
jan 1, 1998
5.233
-1.002
-16.07%
jan 1, 1999
5.74
+0.507
9.69%
jan 1, 2000
6.248
+0.508
8.85%
jan 1, 2001
7.44
+1.192
19.08%
jan 1, 2002
10.397
+2.956
39.73%
jan 1, 2003
10.576
+0.179
1.72%
jan 1, 2004
9.927
-0.649
-6.14%
jan 1, 2005
10.205
+0.278
2.8%
jan 1, 2006
7.34
-2.865
-28.07%
jan 1, 2007
8.604
+1.264
17.22%
jan 1, 2008
4.435
-4.169
-48.45%
jan 1, 2009
4.713
+0.278
6.26%
jan 1, 2010
4.024
-0.689
-14.62%
jan 1, 2011
4.31
+0.286
7.11%
jan 1, 2012
3.542
-0.767
-17.8%
jan 1, 2013
1.894
-1.648
-46.53%
jan 1, 2014
1.772
-0.122
-6.46%
jan 1, 2015
1.77
-0.001
-0.07%
jan 1, 2016
2.291
+0.52
29.39%
Ranking of countries by current statistics by years


Comments: