29
/
en
AIzaSyAYiBZKx7MnpbEhh9jyipgxe19OcubqV5w
April 1, 2024
141211
Ghana
GHA
true
2
1
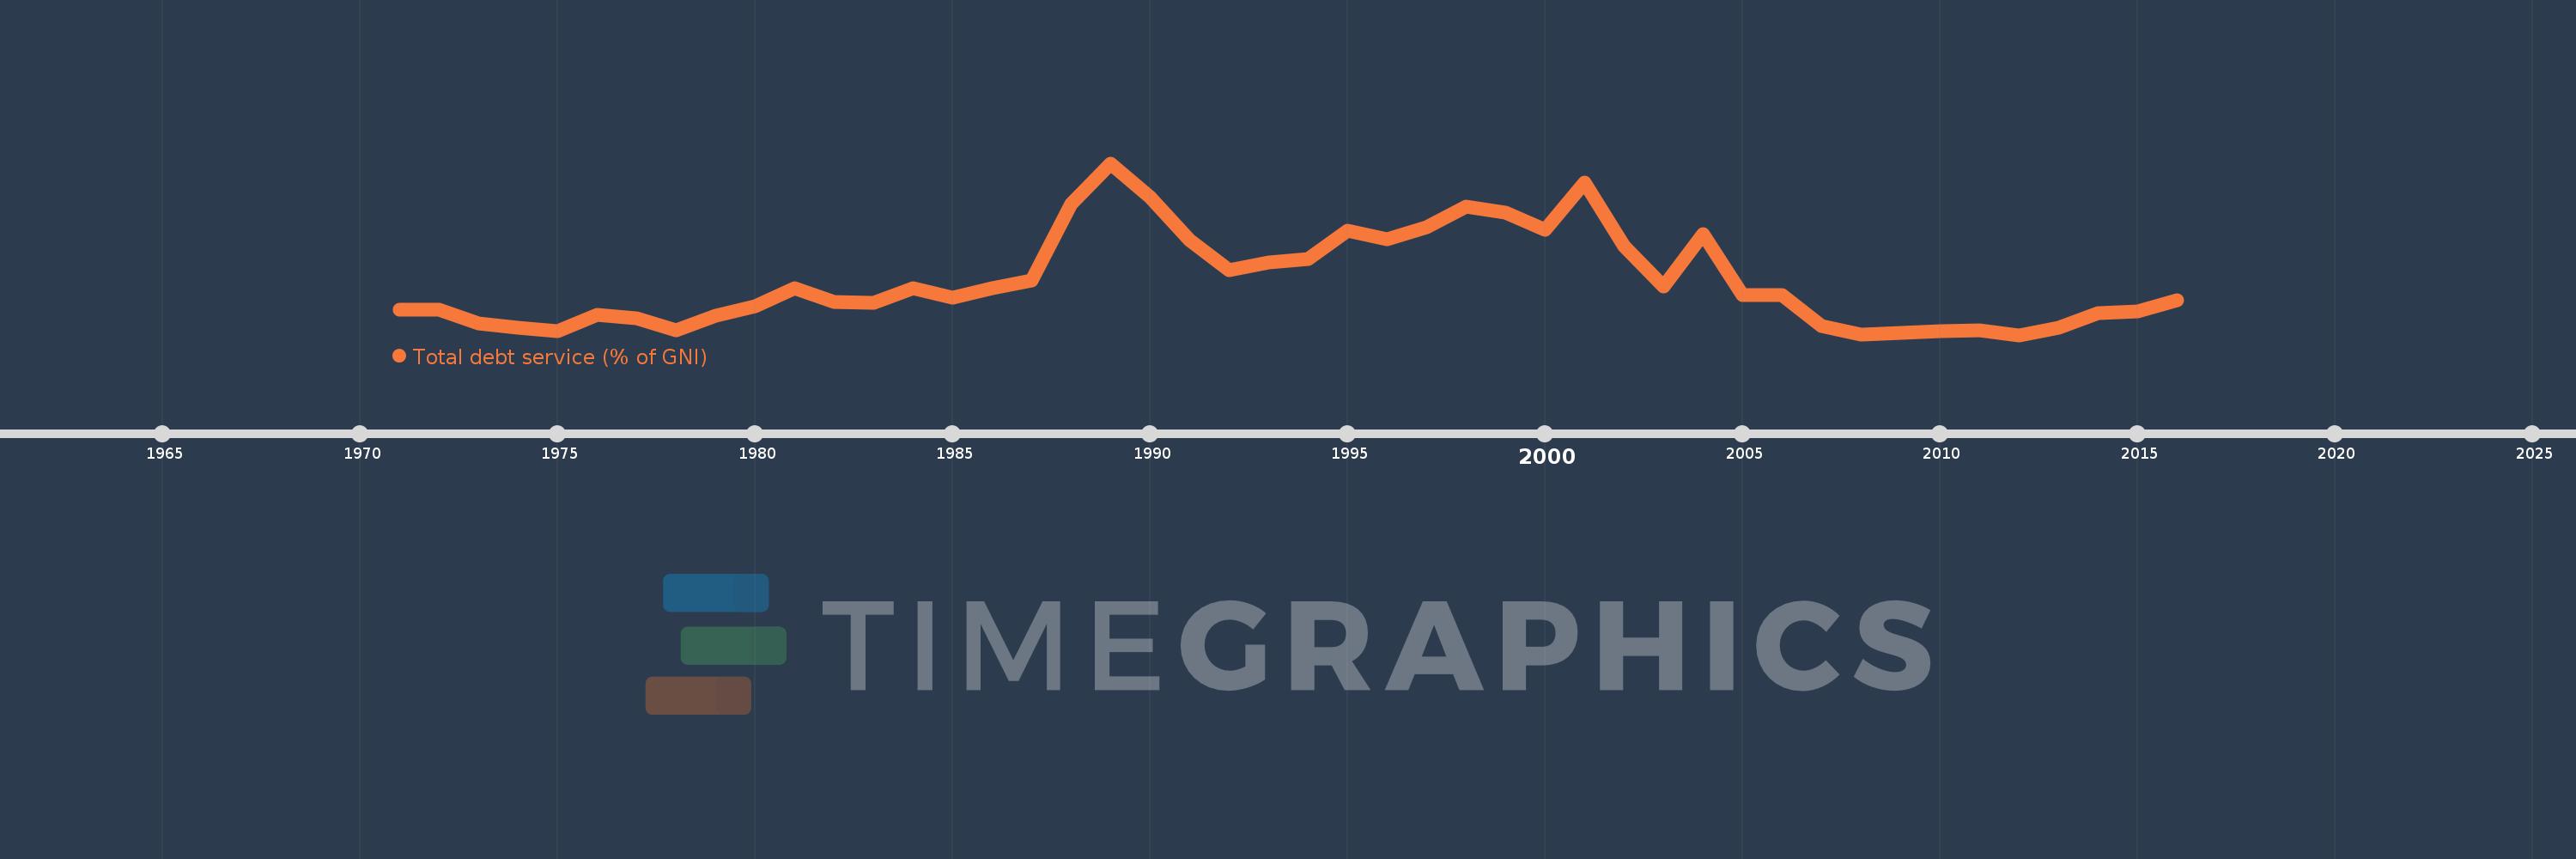
Total debt service (% of GNI)
2016,2015,2014,2013,2012,2011,2010,2009,2008,2007,2006,2005,2004,2003,2002,2001,2000,1999,1998,1997,1996,1995,1994,1993,1992,1991,1990,1989,1988,1987,1986,1985,1984,1983,1982,1981,1980,1979,1978,1977,1976,1975,1974,1973,1972,1971
This statistics in other country:
Timeline:
This timeline shows a graph from 1971 to 2016 of Ghana. No data until 1970. Number of actual observations by date: 46.
Source name:
World Development Indicators
Source organization:
World Bank, International Debt Statistics.
Categories, topics:
Economy & Growth, External Debt
Last updated:
apr 23, 2017
Indicators value changes by year
At the date of observation
Value
Absolute change
Change from previous value
jan 1, 1971
2.355
+2.355
0.0%
jan 1, 1972
2.388
+0.032
1.38%
jan 1, 1973
1.562
-0.825
-34.57%
jan 1, 1974
1.322
-0.24
-15.39%
jan 1, 1975
1.143
-0.179
-13.54%
jan 1, 1976
2.083
+0.94
82.27%
jan 1, 1977
1.892
-0.191
-9.18%
jan 1, 1978
1.193
-0.699
-36.95%
jan 1, 1979
2.024
+0.831
69.65%
jan 1, 1980
2.586
+0.562
27.78%
jan 1, 1981
3.593
+1.007
38.96%
jan 1, 1982
2.816
-0.777
-21.63%
jan 1, 1983
2.759
-0.057
-2.03%
jan 1, 1984
3.612
+0.853
30.93%
jan 1, 1985
3.044
-0.568
-15.72%
jan 1, 1986
3.602
+0.558
18.33%
jan 1, 1987
4.069
+0.467
12.96%
jan 1, 1988
8.407
+4.337
106.59%
jan 1, 1989
10.77
+2.363
28.11%
jan 1, 1990
8.841
-1.929
-17.91%
jan 1, 1991
6.371
-2.47
-27.94%
jan 1, 1992
4.655
-1.716
-26.93%
jan 1, 1993
5.058
+0.403
8.65%
jan 1, 1994
5.265
+0.207
4.09%
jan 1, 1995
6.917
+1.652
31.38%
jan 1, 1996
6.41
-0.507
-7.33%
jan 1, 1997
7.105
+0.696
10.85%
jan 1, 1998
8.273
+1.167
16.43%
jan 1, 1999
7.945
-0.328
-3.96%
jan 1, 2000
6.964
-0.981
-12.35%
jan 1, 2001
9.669
+2.705
38.84%
jan 1, 2002
5.998
-3.671
-37.97%
jan 1, 2003
3.679
-2.319
-38.66%
jan 1, 2004
6.725
+3.046
82.8%
jan 1, 2005
3.193
-3.532
-52.52%
jan 1, 2006
3.212
+0.019
0.6%
jan 1, 2007
1.425
-1.787
-55.64%
jan 1, 2008
0.954
-0.471
-33.05%
jan 1, 2009
1.038
+0.084
8.77%
jan 1, 2010
1.122
+0.085
8.14%
jan 1, 2011
1.197
+0.075
6.71%
jan 1, 2012
0.919
-0.278
-23.25%
jan 1, 2013
1.347
+0.427
46.51%
jan 1, 2014
2.151
+0.804
59.72%
jan 1, 2015
2.259
+0.109
5.05%
jan 1, 2016
2.896
+0.637
28.2%
Ranking of countries by current statistics by years


Comments: