29
/
en
AIzaSyAYiBZKx7MnpbEhh9jyipgxe19OcubqV5w
April 1, 2024
201084
Montenegro
MNE
true
2
1
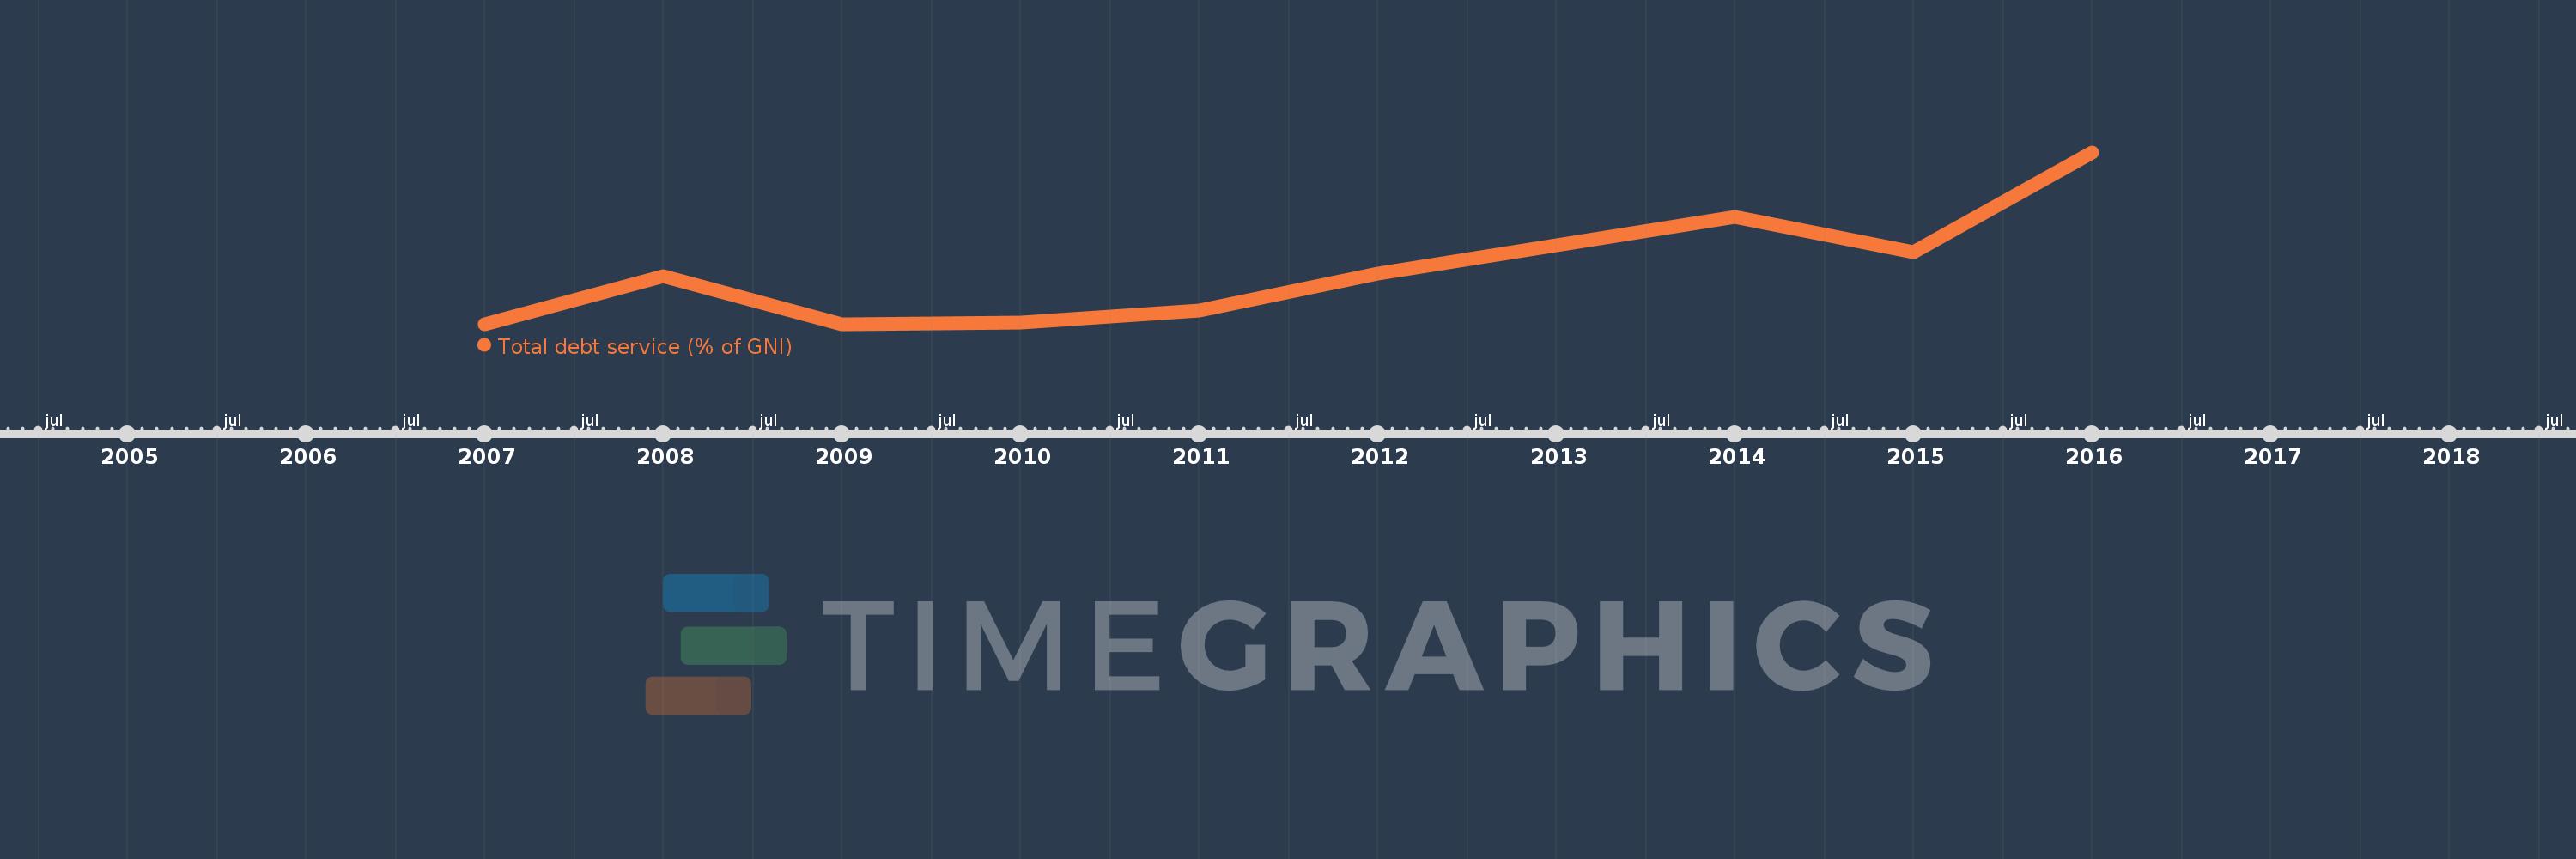
Total debt service (% of GNI)
2016,2015,2014,2013,2012,2011,2010,2009,2008,2007
This statistics in other country:
Timeline:
This timeline shows a graph from 2007 to 2016 of Montenegro. No data until 2006. Number of actual observations by date: 10.
Source name:
World Development Indicators
Source organization:
World Bank, International Debt Statistics.
Categories, topics:
Economy & Growth, External Debt
Last updated:
apr 23, 2017
Indicators value changes by year
Maximum:
12.223
jan 1, 2016
At the date of observation
Value
Absolute change
Change from previous value
jan 1, 2007
1.544
+1.544
0.0%
jan 1, 2008
4.547
+3.003
194.53%
jan 1, 2009
1.539
-3.008
-66.15%
jan 1, 2010
1.654
+0.115
7.47%
jan 1, 2011
2.384
+0.73
44.15%
jan 1, 2012
4.66
+2.276
95.47%
jan 1, 2013
6.47
+1.809
38.82%
jan 1, 2014
8.215
+1.746
26.98%
jan 1, 2015
6.02
-2.196
-26.73%
jan 1, 2016
12.223
+6.203
103.04%
Ranking of countries by current statistics by years


Comments: