29
/
en
AIzaSyAYiBZKx7MnpbEhh9jyipgxe19OcubqV5w
April 1, 2024
127006
El Salvador
SLV
true
2
1
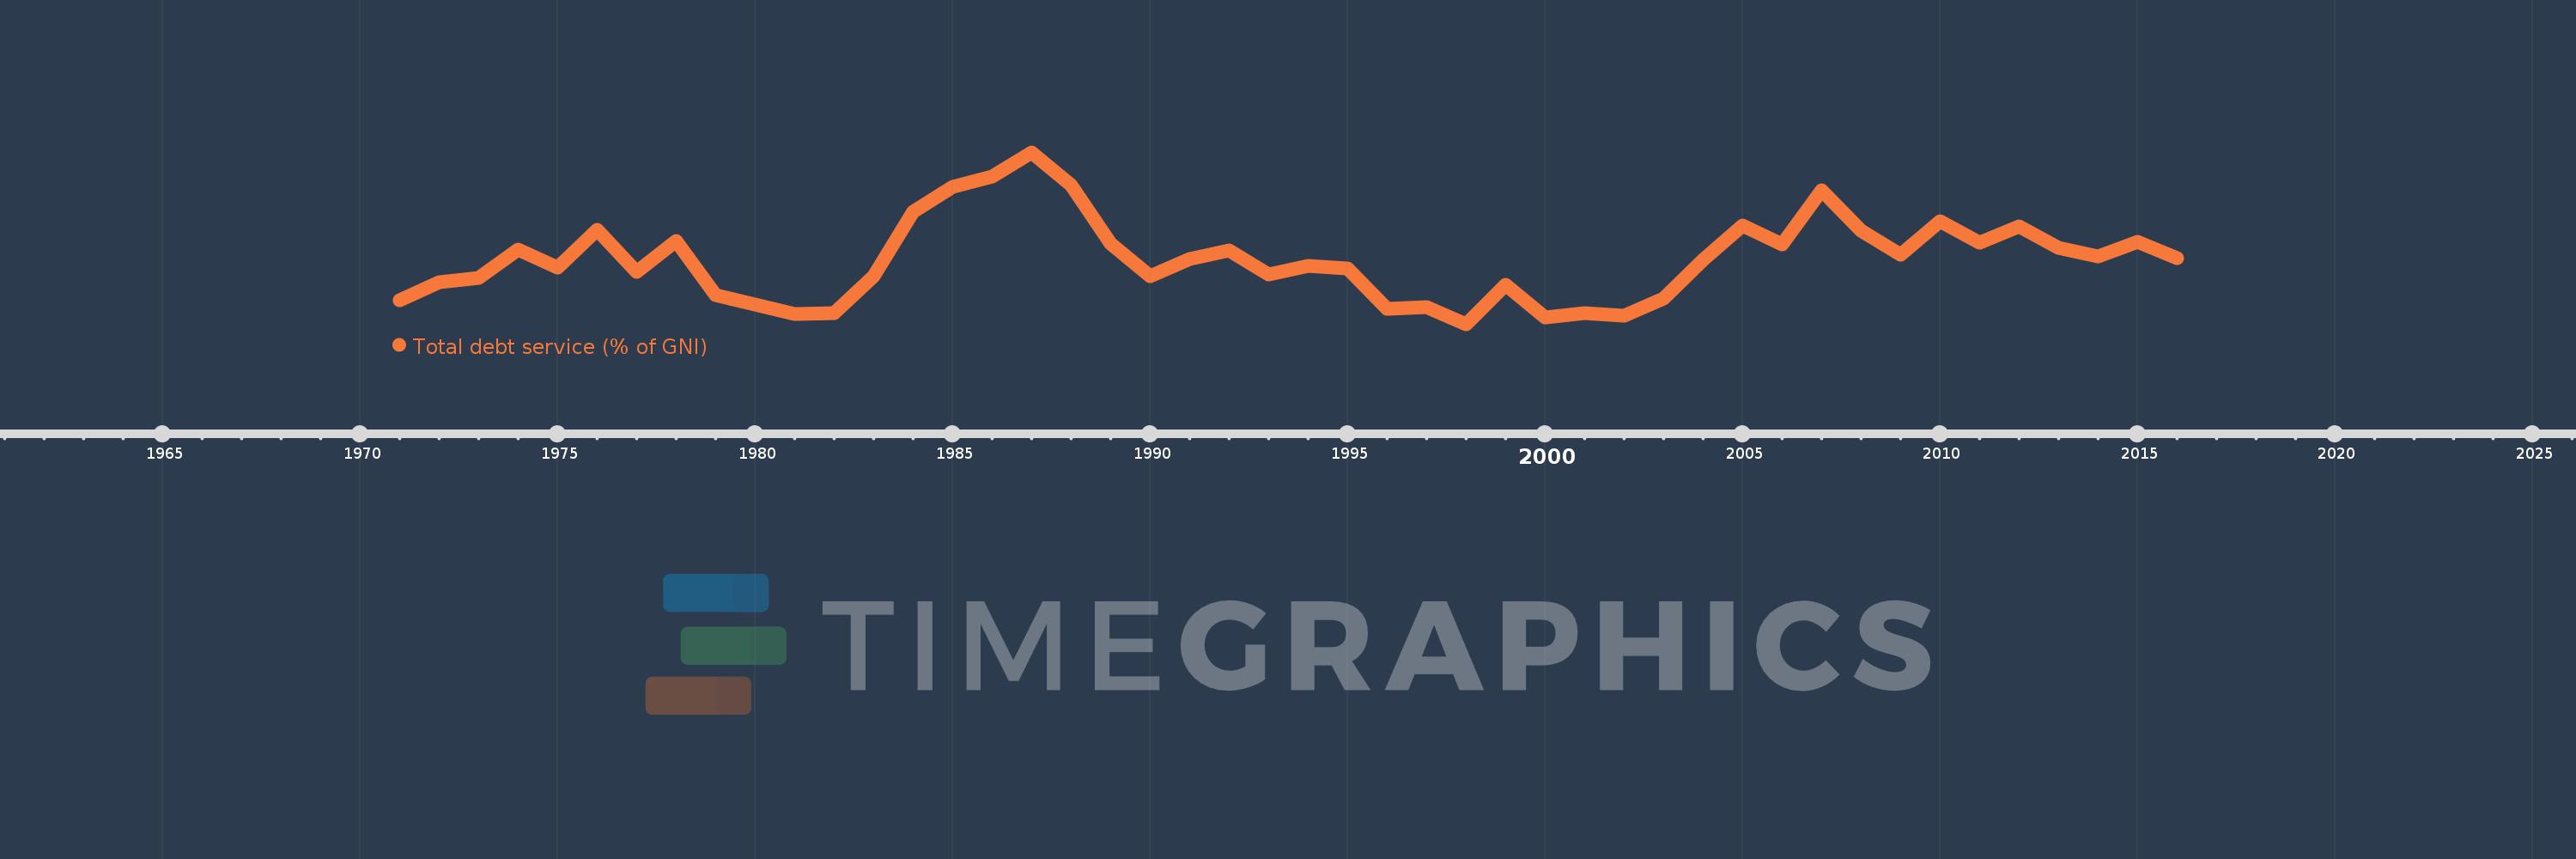
Total debt service (% of GNI)
2016,2015,2014,2013,2012,2011,2010,2009,2008,2007,2006,2005,2004,2003,2002,2001,2000,1999,1998,1997,1996,1995,1994,1993,1992,1991,1990,1989,1988,1987,1986,1985,1984,1983,1982,1981,1980,1979,1978,1977,1976,1975,1974,1973,1972,1971
This statistics in other country:
Timeline:
This timeline shows a graph from 1971 to 2016 of El Salvador. No data until 1970. Number of actual observations by date: 46.
Source name:
World Development Indicators
Source organization:
World Bank, International Debt Statistics.
Categories, topics:
Economy & Growth, External Debt
Last updated:
apr 23, 2017
Indicators value changes by year
At the date of observation
Value
Absolute change
Change from previous value
jan 1, 1971
3.36
+3.36
0.0%
jan 1, 1972
3.913
+0.553
16.46%
jan 1, 1973
4.057
+0.143
3.66%
jan 1, 1974
4.949
+0.893
22.01%
jan 1, 1975
4.4
-0.549
-11.1%
jan 1, 1976
5.604
+1.204
27.35%
jan 1, 1977
4.256
-1.348
-24.06%
jan 1, 1978
5.231
+0.976
22.93%
jan 1, 1979
3.51
-1.721
-32.91%
jan 1, 1980
3.203
-0.307
-8.75%
jan 1, 1981
2.9
-0.303
-9.46%
jan 1, 1982
2.945
+0.045
1.54%
jan 1, 1983
4.102
+1.157
39.3%
jan 1, 1984
6.16
+2.058
50.16%
jan 1, 1985
6.961
+0.801
13.01%
jan 1, 1986
7.282
+0.321
4.62%
jan 1, 1987
8.053
+0.771
10.59%
jan 1, 1988
7.008
-1.045
-12.98%
jan 1, 1989
5.158
-1.85
-26.39%
jan 1, 1990
4.106
-1.053
-20.41%
jan 1, 1991
4.648
+0.542
13.21%
jan 1, 1992
4.931
+0.283
6.08%
jan 1, 1993
4.157
-0.773
-15.68%
jan 1, 1994
4.454
+0.296
7.13%
jan 1, 1995
4.374
-0.08
-1.8%
jan 1, 1996
3.081
-1.292
-29.54%
jan 1, 1997
3.134
+0.052
1.7%
jan 1, 1998
2.587
-0.547
-17.45%
jan 1, 1999
3.851
+1.264
48.84%
jan 1, 2000
2.809
-1.042
-27.06%
jan 1, 2001
2.931
+0.123
4.36%
jan 1, 2002
2.853
-0.079
-2.69%
jan 1, 2003
3.396
+0.543
19.05%
jan 1, 2004
4.641
+1.246
36.68%
jan 1, 2005
5.722
+1.081
23.29%
jan 1, 2006
5.132
-0.59
-10.31%
jan 1, 2007
6.839
+1.707
33.25%
jan 1, 2008
5.56
-1.279
-18.71%
jan 1, 2009
4.794
-0.766
-13.77%
jan 1, 2010
5.859
+1.065
22.21%
jan 1, 2011
5.184
-0.675
-11.52%
jan 1, 2012
5.702
+0.518
10.0%
jan 1, 2013
5.01
-0.692
-12.14%
jan 1, 2014
4.753
-0.257
-5.13%
jan 1, 2015
5.198
+0.445
9.37%
jan 1, 2016
4.677
-0.522
-10.04%
Ranking of countries by current statistics by years


Comments: