29
/
en
AIzaSyAYiBZKx7MnpbEhh9jyipgxe19OcubqV5w
April 1, 2024
174885
Lao PDR
LAO
true
2
1
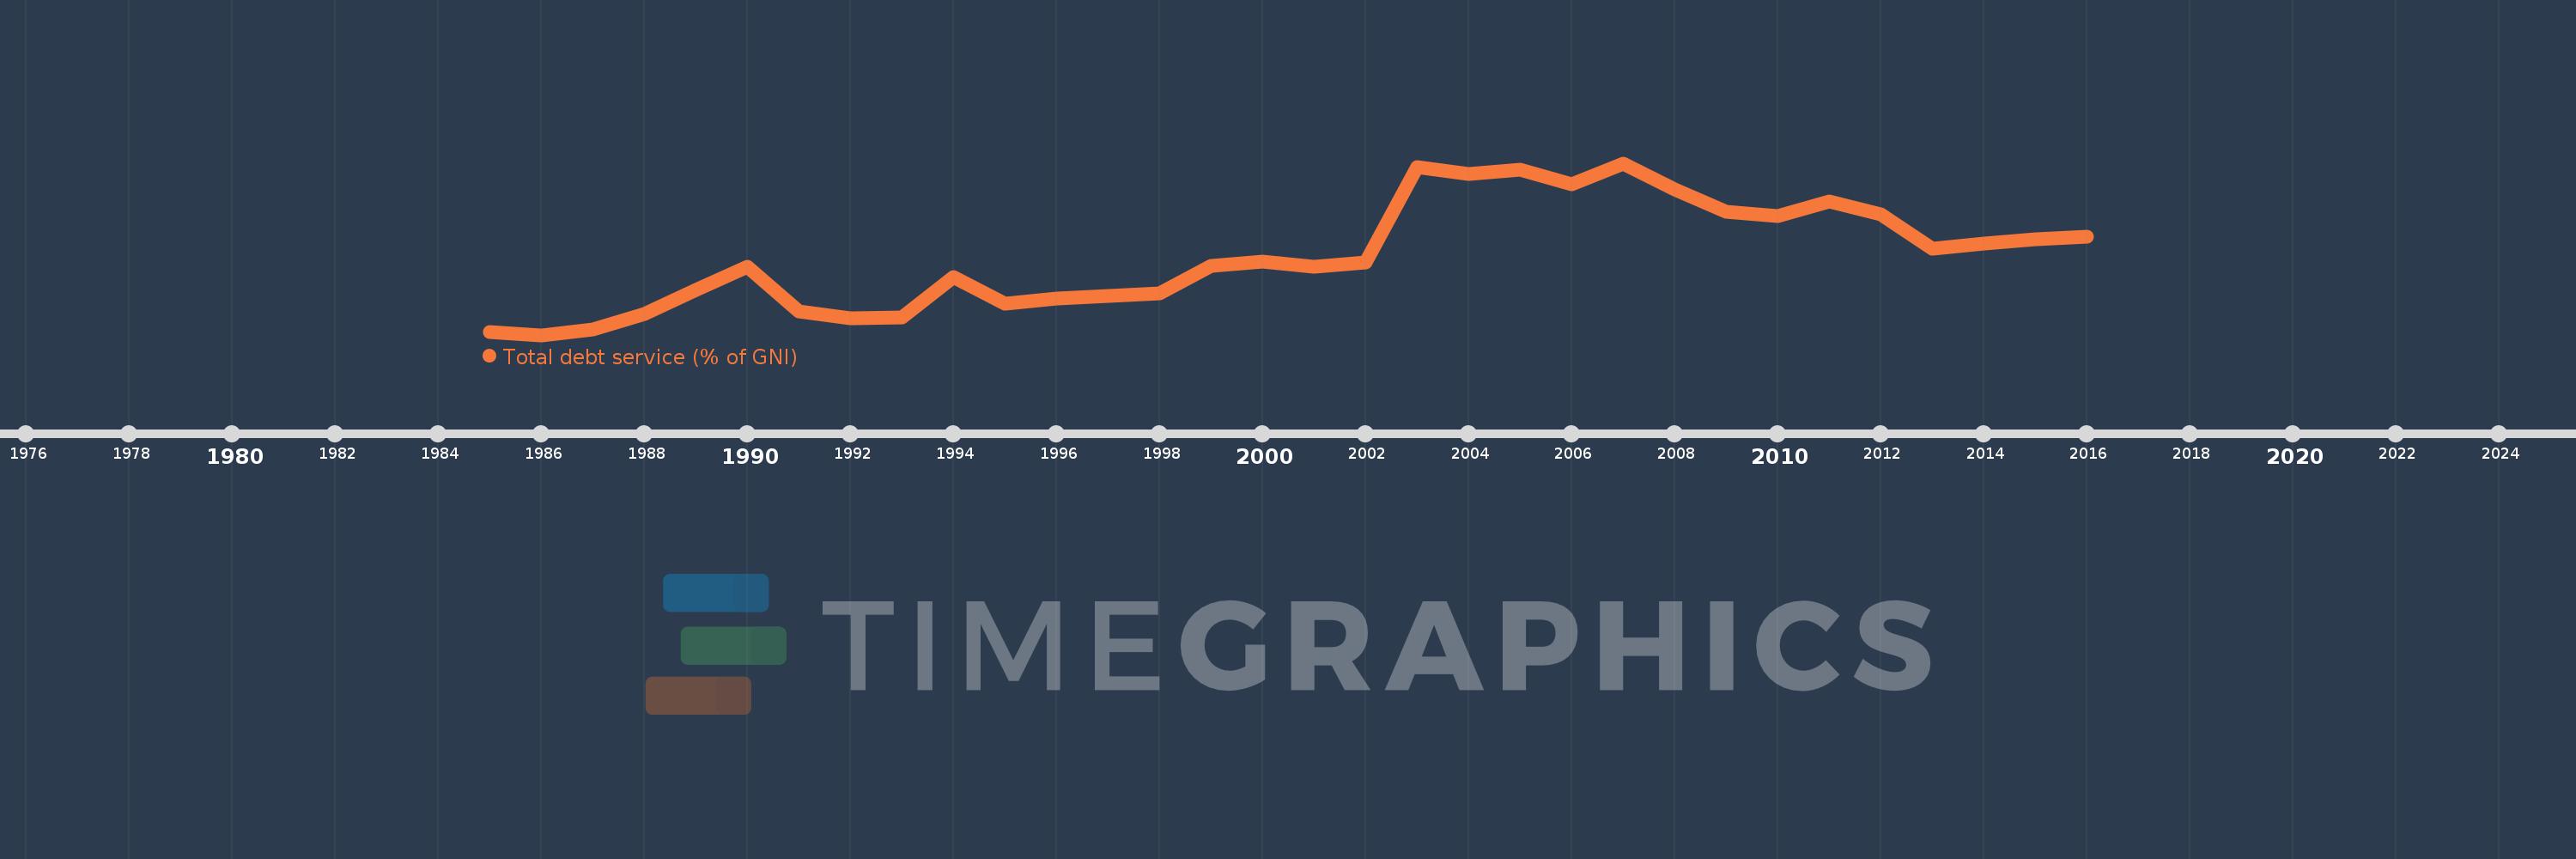
Total debt service (% of GNI)
2016,2015,2014,2013,2012,2011,2010,2009,2008,2007,2006,2005,2004,2003,2002,2001,2000,1999,1998,1997,1996,1995,1994,1993,1992,1991,1990,1989,1988,1987,1986,1985
This statistics in other country:
Timeline:
This timeline shows a graph from 1985 to 2016 of Lao PDR. No data until 1984. Number of actual observations by date: 32.
Source name:
World Development Indicators
Source organization:
World Bank, International Debt Statistics.
Categories, topics:
Economy & Growth, External Debt
Last updated:
apr 23, 2017
Indicators value changes by year
At the date of observation
Value
Absolute change
Change from previous value
jan 1, 1985
0.389
+0.389
0.0%
jan 1, 1986
0.291
-0.097
-25.02%
jan 1, 1987
0.475
+0.184
63.16%
jan 1, 1988
0.961
+0.486
102.26%
jan 1, 1989
1.719
+0.758
78.8%
jan 1, 1990
2.452
+0.733
42.62%
jan 1, 1991
1.039
-1.413
-57.63%
jan 1, 1992
0.827
-0.212
-20.37%
jan 1, 1993
0.846
+0.018
2.22%
jan 1, 1994
2.14
+1.294
153.07%
jan 1, 1995
1.283
-0.857
-40.06%
jan 1, 1996
1.451
+0.169
13.15%
jan 1, 1997
1.53
+0.079
5.44%
jan 1, 1998
1.606
+0.076
4.98%
jan 1, 1999
2.477
+0.871
54.2%
jan 1, 2000
2.614
+0.137
5.53%
jan 1, 2001
2.458
-0.155
-5.94%
jan 1, 2002
2.598
+0.14
5.69%
jan 1, 2003
5.599
+3.001
115.5%
jan 1, 2004
5.387
-0.213
-3.8%
jan 1, 2005
5.516
+0.13
2.4%
jan 1, 2006
5.076
-0.44
-7.98%
jan 1, 2007
5.731
+0.655
12.9%
jan 1, 2008
4.91
-0.82
-14.32%
jan 1, 2009
4.207
-0.704
-14.33%
jan 1, 2010
4.054
-0.153
-3.65%
jan 1, 2011
4.52
+0.467
11.51%
jan 1, 2012
4.105
-0.415
-9.18%
jan 1, 2013
3.035
-1.07
-26.06%
jan 1, 2014
3.193
+0.158
5.21%
jan 1, 2015
3.336
+0.143
4.47%
jan 1, 2016
3.395
+0.059
1.78%
Ranking of countries by current statistics by years


Comments: