29
/
en
AIzaSyAYiBZKx7MnpbEhh9jyipgxe19OcubqV5w
April 1, 2024
211180
Nicaragua
NIC
true
2
1
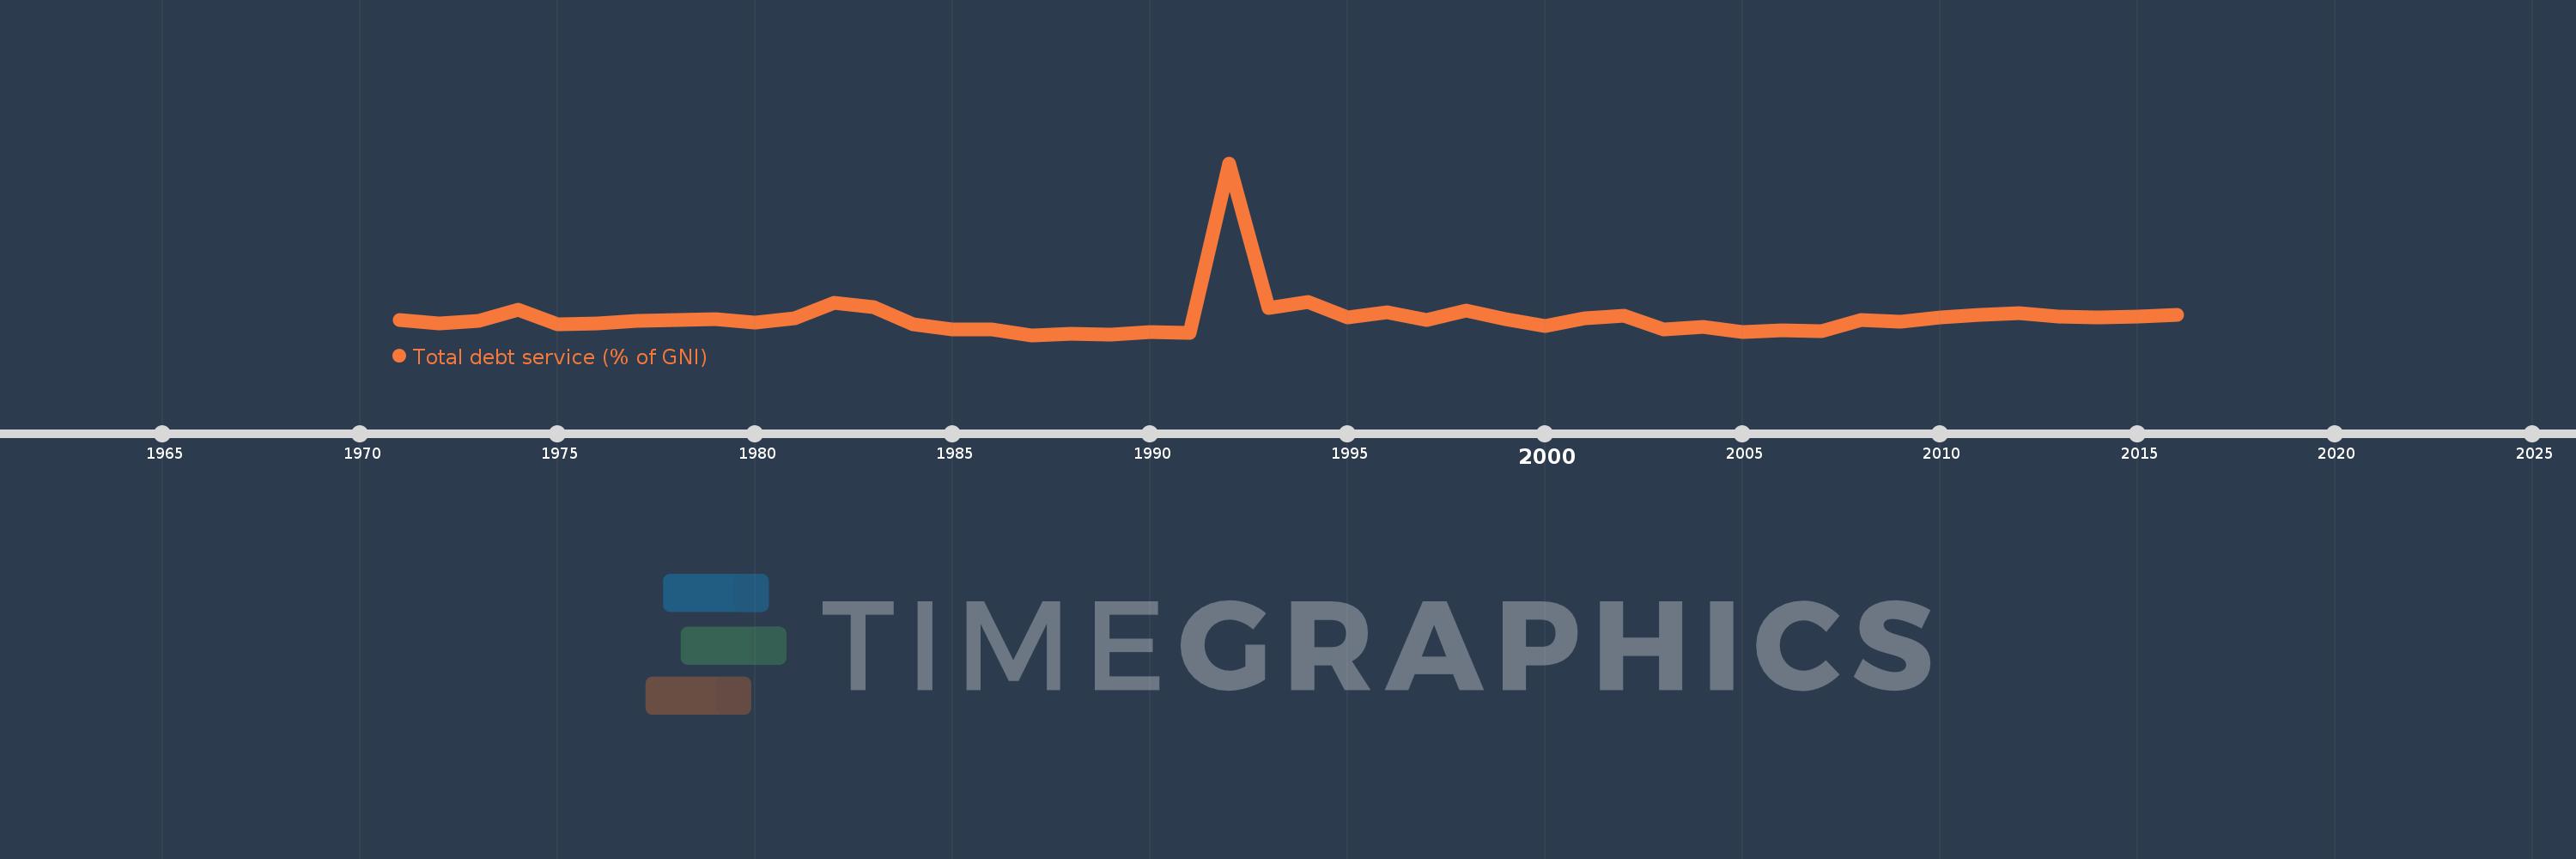
Total debt service (% of GNI)
2016,2015,2014,2013,2012,2011,2010,2009,2008,2007,2006,2005,2004,2003,2002,2001,2000,1999,1998,1997,1996,1995,1994,1993,1992,1991,1990,1989,1988,1987,1986,1985,1984,1983,1982,1981,1980,1979,1978,1977,1976,1975,1974,1973,1972,1971
This statistics in other country:
Timeline:
This timeline shows a graph from 1971 to 2016 of Nicaragua. No data until 1970. Number of actual observations by date: 46.
Source name:
World Development Indicators
Source organization:
World Bank, International Debt Statistics.
Categories, topics:
Economy & Growth, External Debt
Last updated:
apr 23, 2017
Indicators value changes by year
Maximum:
47.109
jan 1, 1992
At the date of observation
Value
Absolute change
Change from previous value
jan 1, 1971
5.519
+5.519
0.0%
jan 1, 1972
4.557
-0.962
-17.43%
jan 1, 1973
5.318
+0.761
16.7%
jan 1, 1974
8.275
+2.957
55.6%
jan 1, 1975
4.394
-3.881
-46.9%
jan 1, 1976
4.717
+0.322
7.34%
jan 1, 1977
5.271
+0.555
11.76%
jan 1, 1978
5.448
+0.177
3.36%
jan 1, 1979
5.766
+0.317
5.83%
jan 1, 1980
4.763
-1.003
-17.4%
jan 1, 1981
5.909
+1.146
24.07%
jan 1, 1982
10.195
+4.286
72.53%
jan 1, 1983
9.051
-1.143
-11.22%
jan 1, 1984
4.335
-4.716
-52.1%
jan 1, 1985
3.079
-1.257
-28.99%
jan 1, 1986
2.987
-0.091
-2.96%
jan 1, 1987
1.564
-1.423
-47.63%
jan 1, 1988
1.922
+0.358
22.87%
jan 1, 1989
1.619
-0.303
-15.76%
jan 1, 1990
2.378
+0.758
46.83%
jan 1, 1991
2.047
-0.331
-13.91%
jan 1, 1992
47.109
+45.062
2.2K%
jan 1, 1993
8.73
-38.379
-81.47%
jan 1, 1994
10.334
+1.604
18.38%
jan 1, 1995
6.192
-4.142
-40.08%
jan 1, 1996
7.696
+1.504
24.28%
jan 1, 1997
5.54
-2.155
-28.01%
jan 1, 1998
7.963
+2.423
43.73%
jan 1, 1999
5.762
-2.201
-27.64%
jan 1, 2000
4.067
-1.695
-29.42%
jan 1, 2001
5.9
+1.833
45.07%
jan 1, 2002
6.686
+0.785
13.31%
jan 1, 2003
3.132
-3.554
-53.16%
jan 1, 2004
3.786
+0.655
20.9%
jan 1, 2005
2.356
-1.43
-37.78%
jan 1, 2006
2.818
+0.463
19.63%
jan 1, 2007
2.574
-0.244
-8.66%
jan 1, 2008
5.536
+2.962
115.04%
jan 1, 2009
5.199
-0.337
-6.09%
jan 1, 2010
6.247
+1.048
20.15%
jan 1, 2011
6.88
+0.633
10.14%
jan 1, 2012
7.375
+0.495
7.2%
jan 1, 2013
6.397
-0.978
-13.26%
jan 1, 2014
6.27
-0.128
-1.99%
jan 1, 2015
6.482
+0.212
3.38%
jan 1, 2016
6.802
+0.321
4.95%
Ranking of countries by current statistics by years


Comments: