29
/
en
AIzaSyAYiBZKx7MnpbEhh9jyipgxe19OcubqV5w
April 1, 2024
202388
Morocco
MAR
true
2
1
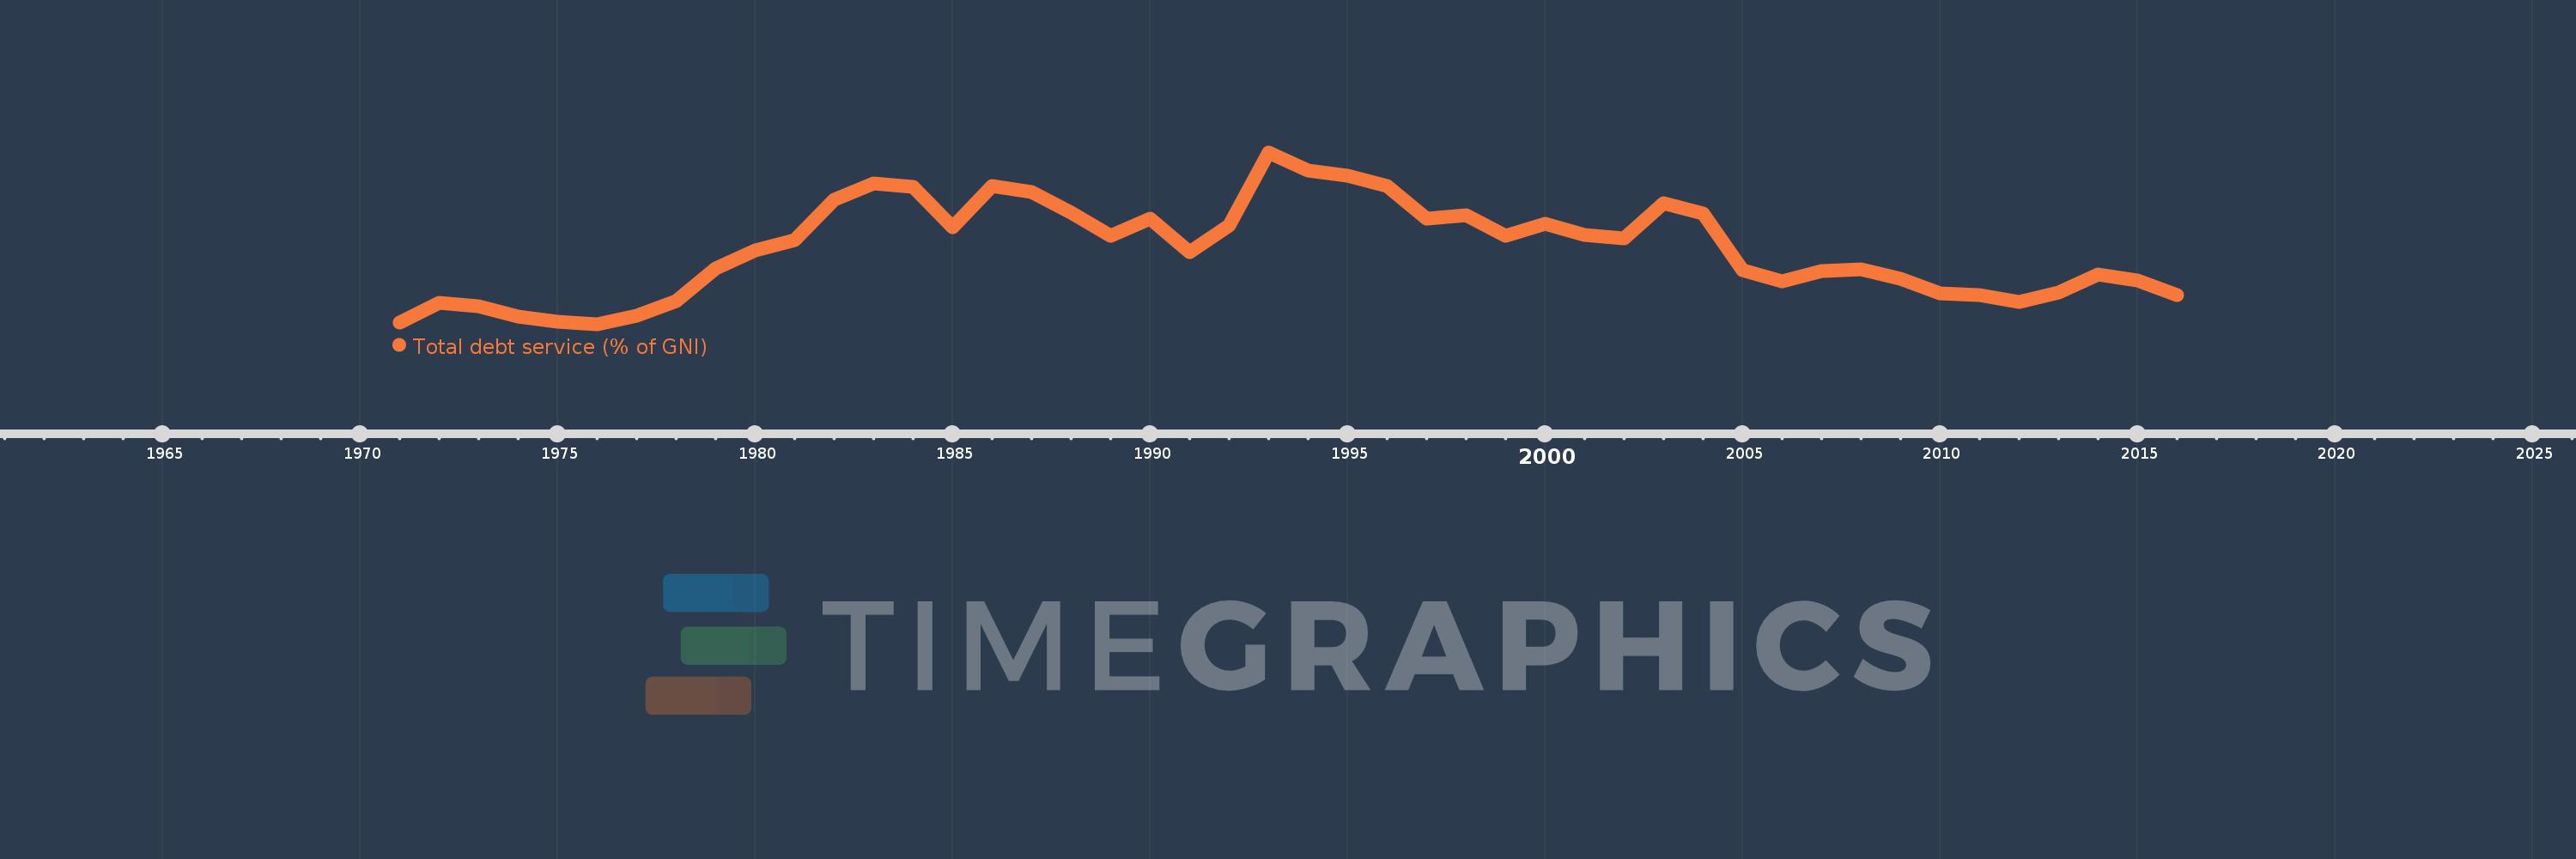
Total debt service (% of GNI)
2016,2015,2014,2013,2012,2011,2010,2009,2008,2007,2006,2005,2004,2003,2002,2001,2000,1999,1998,1997,1996,1995,1994,1993,1992,1991,1990,1989,1988,1987,1986,1985,1984,1983,1982,1981,1980,1979,1978,1977,1976,1975,1974,1973,1972,1971
This statistics in other country:
Timeline:
This timeline shows a graph from 1971 to 2016 of Morocco. No data until 1970. Number of actual observations by date: 46.
Source name:
World Development Indicators
Source organization:
World Bank, International Debt Statistics.
Categories, topics:
Economy & Growth, External Debt
Last updated:
apr 23, 2017
Indicators value changes by year
Maximum:
11.885
jan 1, 1993
At the date of observation
Value
Absolute change
Change from previous value
jan 1, 1971
2.026
+2.026
0.0%
jan 1, 1972
3.156
+1.131
55.81%
jan 1, 1973
2.965
-0.191
-6.06%
jan 1, 1974
2.365
-0.6
-20.23%
jan 1, 1975
2.077
-0.289
-12.21%
jan 1, 1976
1.922
-0.154
-7.43%
jan 1, 1977
2.439
+0.517
26.91%
jan 1, 1978
3.266
+0.827
33.9%
jan 1, 1979
5.134
+1.868
57.2%
jan 1, 1980
6.22
+1.085
21.14%
jan 1, 1981
6.794
+0.575
9.24%
jan 1, 1982
9.146
+2.352
34.62%
jan 1, 1983
10.082
+0.935
10.23%
jan 1, 1984
9.877
-0.205
-2.03%
jan 1, 1985
7.534
-2.344
-23.73%
jan 1, 1986
9.961
+2.428
32.22%
jan 1, 1987
9.605
-0.356
-3.57%
jan 1, 1988
8.395
-1.21
-12.6%
jan 1, 1989
7.059
-1.336
-15.92%
jan 1, 1990
8.036
+0.978
13.85%
jan 1, 1991
6.126
-1.91
-23.77%
jan 1, 1992
7.652
+1.526
24.92%
jan 1, 1993
11.885
+4.232
55.31%
jan 1, 1994
10.858
-1.026
-8.63%
jan 1, 1995
10.518
-0.34
-3.14%
jan 1, 1996
9.949
-0.569
-5.41%
jan 1, 1997
8.035
-1.914
-19.24%
jan 1, 1998
8.23
+0.195
2.42%
jan 1, 1999
7.064
-1.166
-14.17%
jan 1, 2000
7.735
+0.672
9.51%
jan 1, 2001
7.121
-0.614
-7.94%
jan 1, 2002
6.892
-0.229
-3.21%
jan 1, 2003
8.94
+2.047
29.7%
jan 1, 2004
8.367
-0.573
-6.41%
jan 1, 2005
5.079
-3.287
-39.29%
jan 1, 2006
4.402
-0.677
-13.32%
jan 1, 2007
4.988
+0.586
13.31%
jan 1, 2008
5.108
+0.12
2.4%
jan 1, 2009
4.556
-0.553
-10.82%
jan 1, 2010
3.72
-0.836
-18.35%
jan 1, 2011
3.591
-0.128
-3.45%
jan 1, 2012
3.232
-0.36
-10.02%
jan 1, 2013
3.737
+0.506
15.65%
jan 1, 2014
4.822
+1.084
29.01%
jan 1, 2015
4.451
-0.371
-7.69%
jan 1, 2016
3.599
-0.851
-19.13%
Ranking of countries by current statistics by years


Comments: