29
/
en
AIzaSyAYiBZKx7MnpbEhh9jyipgxe19OcubqV5w
April 1, 2024
104313
Chad
TCD
true
2
1
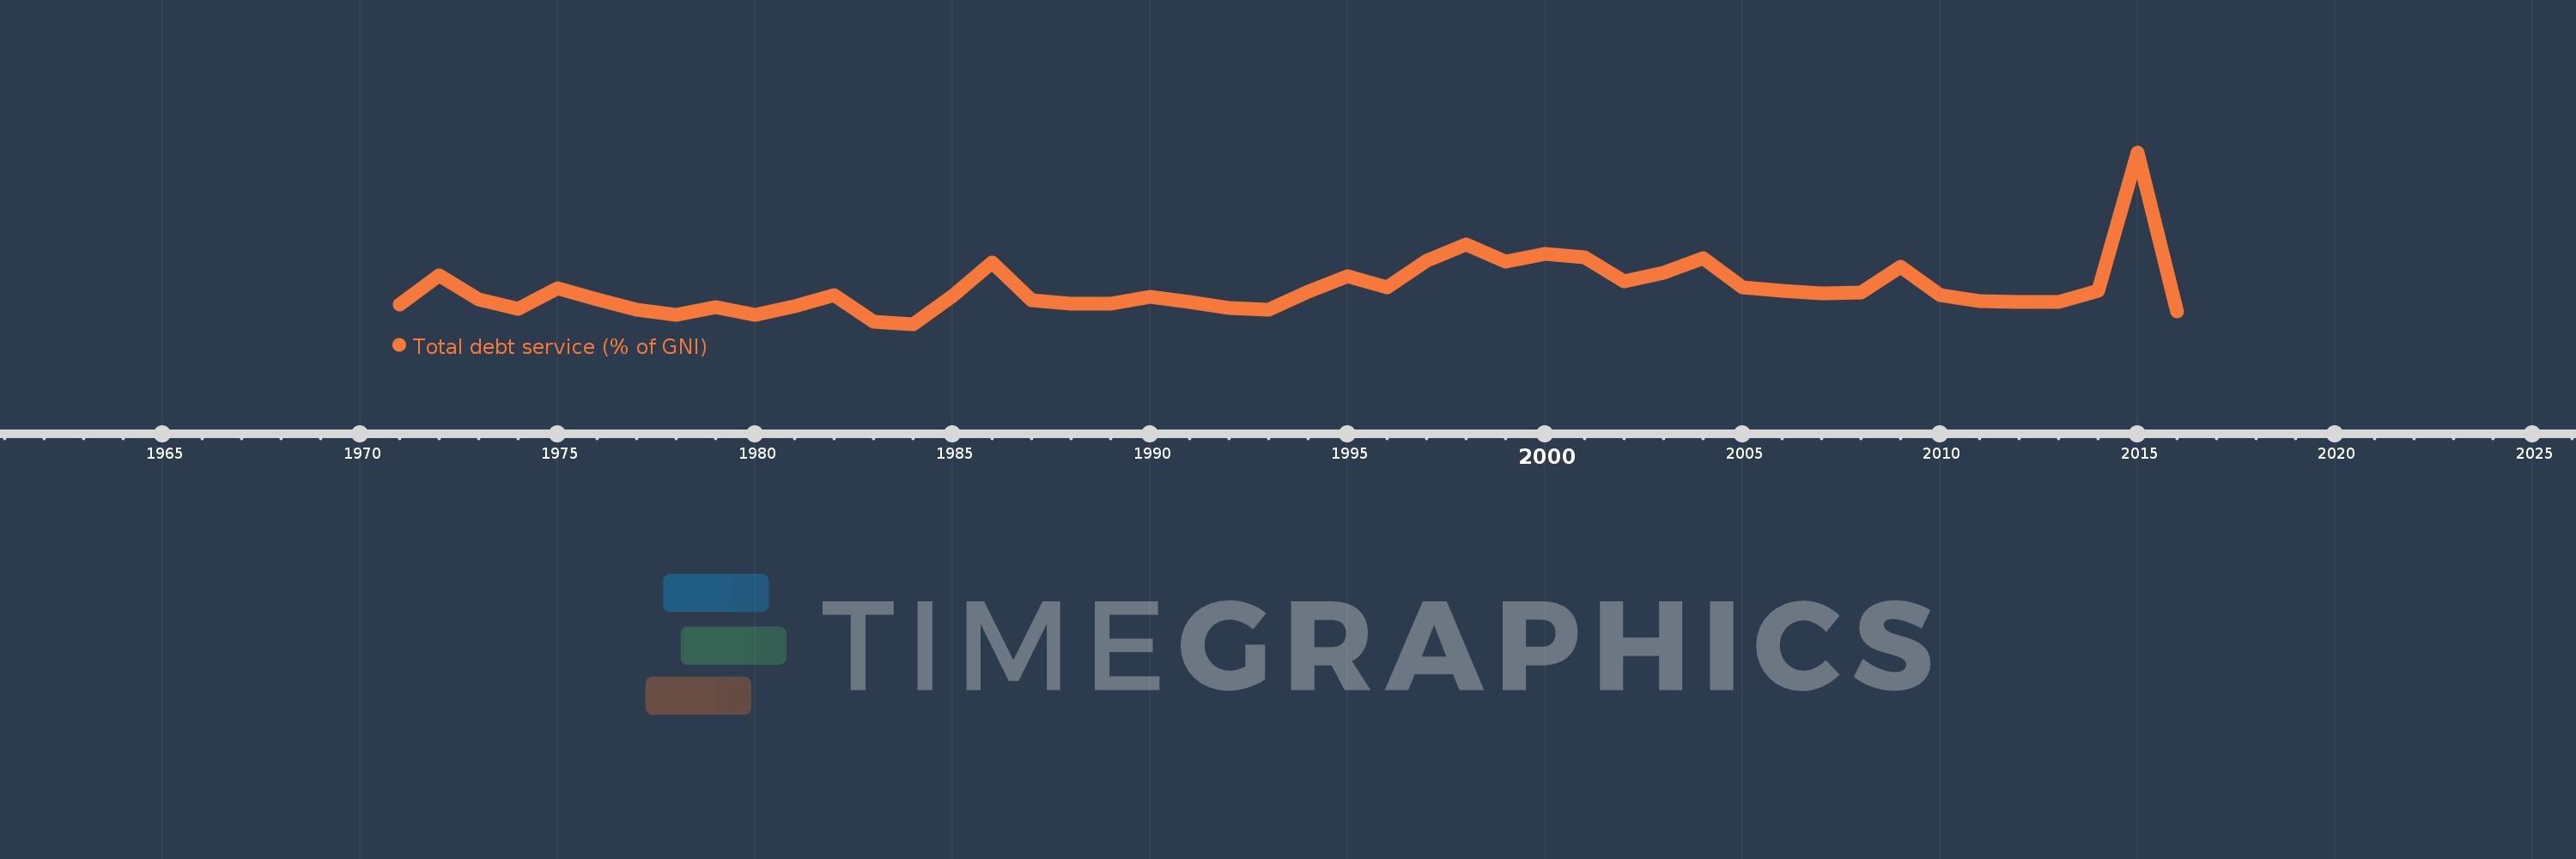
Total debt service (% of GNI)
2016,2015,2014,2013,2012,2011,2010,2009,2008,2007,2006,2005,2004,2003,2002,2001,2000,1999,1998,1997,1996,1995,1994,1993,1992,1991,1990,1989,1988,1987,1986,1985,1984,1983,1982,1981,1980,1979,1978,1977,1976,1975,1974,1973,1972,1971
This statistics in other country:
Timeline:
This timeline shows a graph from 1971 to 2016 of Chad. No data until 1970. Number of actual observations by date: 46.
Source name:
World Development Indicators
Source organization:
World Bank, International Debt Statistics.
Categories, topics:
Economy & Growth, External Debt
Last updated:
apr 23, 2017
Indicators value changes by year
At the date of observation
Value
Absolute change
Change from previous value
jan 1, 1971
0.621
+0.621
0.0%
jan 1, 1972
1.357
+0.736
118.4%
jan 1, 1973
0.754
-0.602
-44.4%
jan 1, 1974
0.531
-0.223
-29.57%
jan 1, 1975
1.033
+0.502
94.44%
jan 1, 1976
0.757
-0.276
-26.71%
jan 1, 1977
0.508
-0.249
-32.89%
jan 1, 1978
0.366
-0.142
-27.94%
jan 1, 1979
0.576
+0.21
57.34%
jan 1, 1980
0.362
-0.214
-37.22%
jan 1, 1981
0.577
+0.215
59.46%
jan 1, 1982
0.873
+0.296
51.25%
jan 1, 1983
0.208
-0.664
-76.12%
jan 1, 1984
0.136
-0.072
-34.57%
jan 1, 1985
0.841
+0.705
517.24%
jan 1, 1986
1.696
+0.854
101.54%
jan 1, 1987
0.746
-0.95
-55.99%
jan 1, 1988
0.653
-0.094
-12.57%
jan 1, 1989
0.655
+0.002
0.33%
jan 1, 1990
0.82
+0.165
25.24%
jan 1, 1991
0.687
-0.133
-16.23%
jan 1, 1992
0.536
-0.151
-21.92%
jan 1, 1993
0.494
-0.043
-7.96%
jan 1, 1994
0.957
+0.463
93.85%
jan 1, 1995
1.338
+0.381
39.84%
jan 1, 1996
1.063
-0.275
-20.58%
jan 1, 1997
1.736
+0.673
63.33%
jan 1, 1998
2.13
+0.394
22.71%
jan 1, 1999
1.706
-0.424
-19.89%
jan 1, 2000
1.901
+0.195
11.41%
jan 1, 2001
1.827
-0.074
-3.9%
jan 1, 2002
1.213
-0.614
-33.59%
jan 1, 2003
1.424
+0.211
17.4%
jan 1, 2004
1.806
+0.382
26.83%
jan 1, 2005
1.053
-0.753
-41.69%
jan 1, 2006
0.971
-0.082
-7.81%
jan 1, 2007
0.92
-0.051
-5.22%
jan 1, 2008
0.922
+0.002
0.21%
jan 1, 2009
1.58
+0.658
71.33%
jan 1, 2010
0.876
-0.704
-44.55%
jan 1, 2011
0.71
-0.166
-18.96%
jan 1, 2012
0.699
-0.011
-1.5%
jan 1, 2013
0.691
-0.008
-1.13%
jan 1, 2014
0.973
+0.282
40.75%
jan 1, 2015
4.452
+3.478
357.42%
jan 1, 2016
0.459
-3.993
-89.69%
Ranking of countries by current statistics by years


Comments: