29
/
en
AIzaSyAYiBZKx7MnpbEhh9jyipgxe19OcubqV5w
April 1, 2024
51566
Middle income
MIC
false
2
1
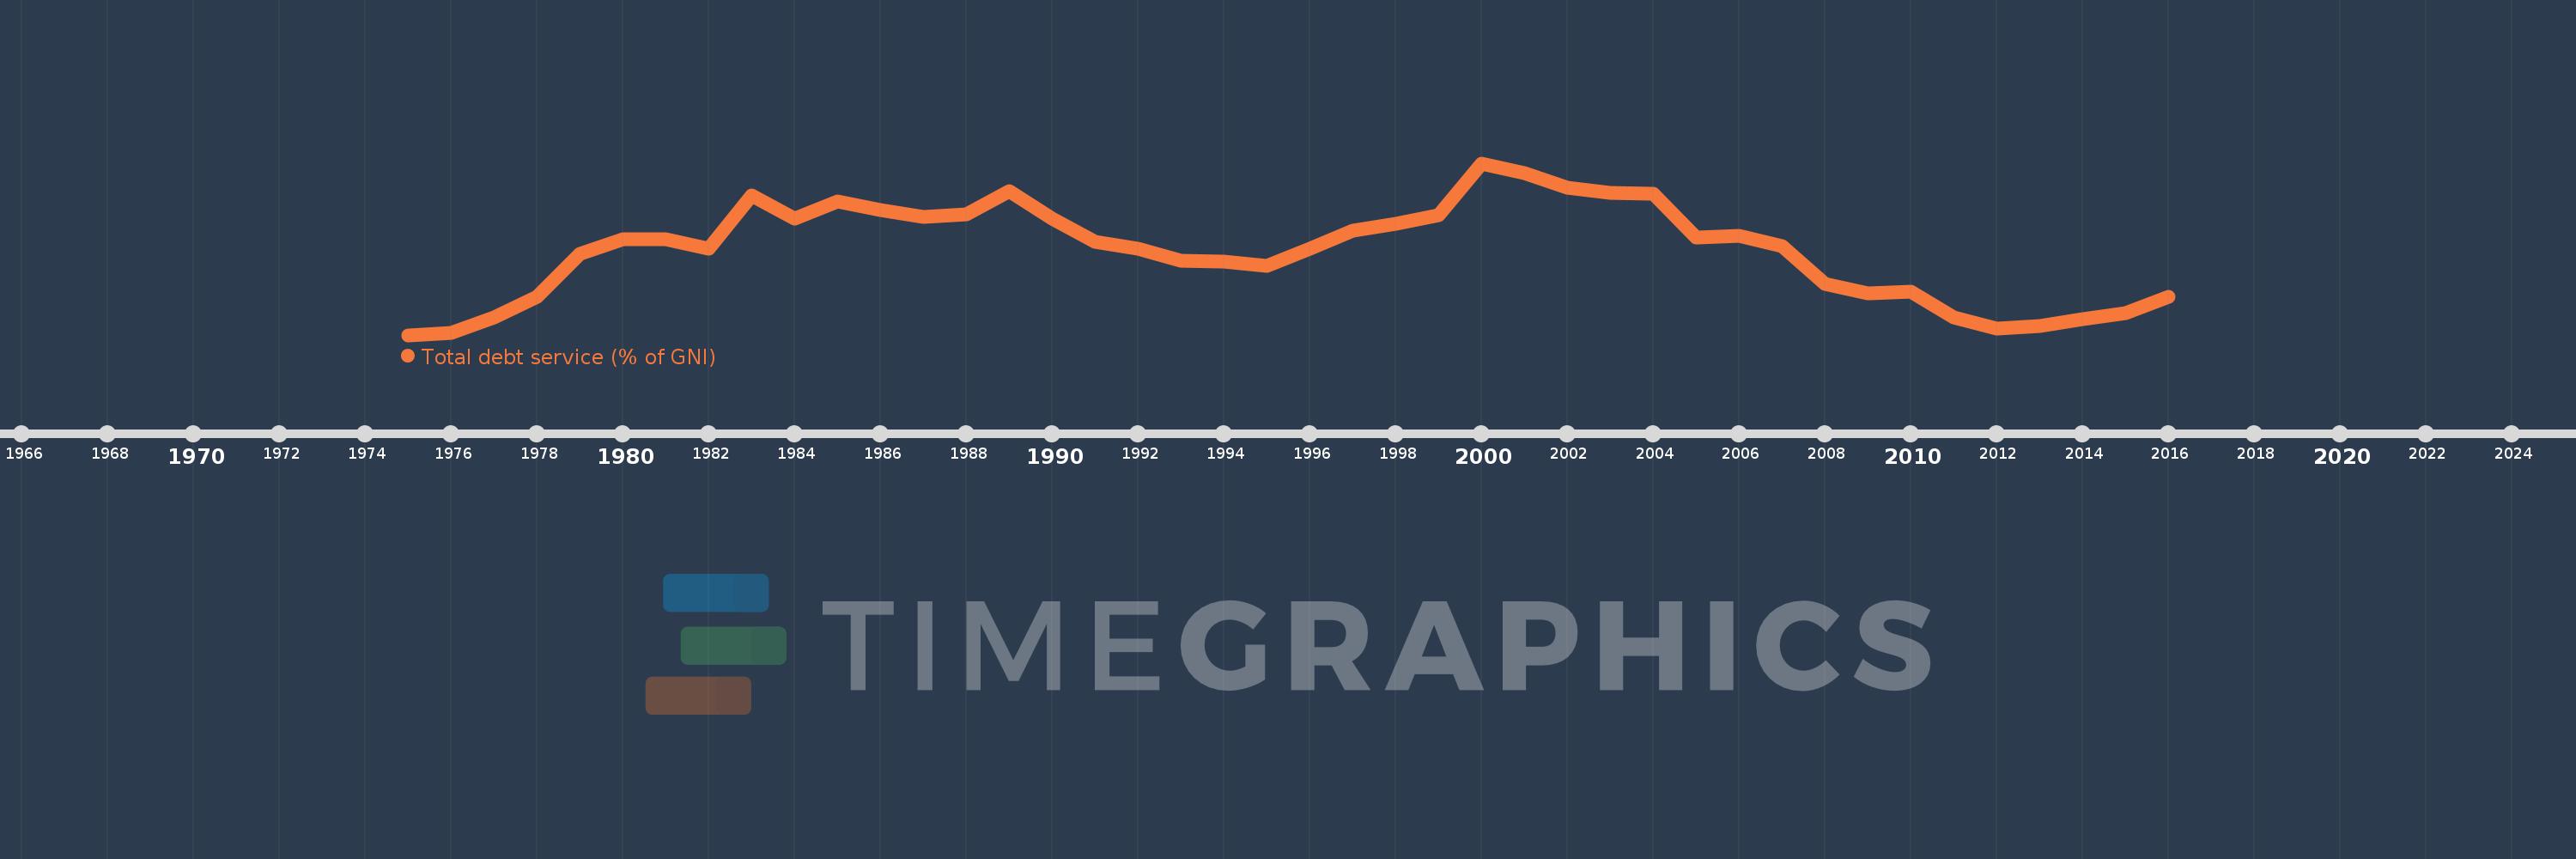
Total debt service (% of GNI)
2016,2015,2014,2013,2012,2011,2010,2009,2008,2007,2006,2005,2004,2003,2002,2001,2000,1999,1998,1997,1996,1995,1994,1993,1992,1991,1990,1989,1988,1987,1986,1985,1984,1983,1982,1981,1980,1979,1978,1977,1976,1975
This statistics in other country:
Timeline:
This timeline shows a graph from 1975 to 2016 of Middle income. No data until 1974. Number of actual observations by date: 42.
Source name:
World Development Indicators
Source organization:
World Bank, International Debt Statistics.
Categories, topics:
Economy & Growth, External Debt
Last updated:
apr 23, 2017
Indicators value changes by year
At the date of observation
Value
Absolute change
Change from previous value
jan 1, 1975
2.302
+2.302
0.0%
jan 1, 1976
2.348
+0.046
2.02%
jan 1, 1977
2.683
+0.335
14.26%
jan 1, 1978
3.139
+0.456
16.98%
jan 1, 1979
4.088
+0.949
30.25%
jan 1, 1980
4.401
+0.313
7.67%
jan 1, 1981
4.4
-0.001
-0.03%
jan 1, 1982
4.19
-0.21
-4.77%
jan 1, 1983
5.367
+1.177
28.08%
jan 1, 1984
4.848
-0.519
-9.67%
jan 1, 1985
5.226
+0.378
7.8%
jan 1, 1986
5.046
-0.18
-3.45%
jan 1, 1987
4.897
-0.149
-2.95%
jan 1, 1988
4.955
+0.058
1.19%
jan 1, 1989
5.448
+0.493
9.94%
jan 1, 1990
4.845
-0.603
-11.07%
jan 1, 1991
4.352
-0.493
-10.18%
jan 1, 1992
4.199
-0.153
-3.51%
jan 1, 1993
3.937
-0.263
-6.25%
jan 1, 1994
3.911
-0.026
-0.65%
jan 1, 1995
3.822
-0.09
-2.3%
jan 1, 1996
4.199
+0.377
9.87%
jan 1, 1997
4.584
+0.386
9.19%
jan 1, 1998
4.74
+0.155
3.39%
jan 1, 1999
4.937
+0.198
4.17%
jan 1, 2000
6.068
+1.131
22.9%
jan 1, 2001
5.845
-0.222
-3.67%
jan 1, 2002
5.529
-0.317
-5.42%
jan 1, 2003
5.417
-0.112
-2.02%
jan 1, 2004
5.406
-0.011
-0.2%
jan 1, 2005
4.437
-0.969
-17.93%
jan 1, 2006
4.484
+0.047
1.07%
jan 1, 2007
4.243
-0.241
-5.37%
jan 1, 2008
3.422
-0.822
-19.36%
jan 1, 2009
3.207
-0.215
-6.28%
jan 1, 2010
3.254
+0.048
1.48%
jan 1, 2011
2.691
-0.563
-17.3%
jan 1, 2012
2.45
-0.242
-8.97%
jan 1, 2013
2.508
+0.058
2.36%
jan 1, 2014
2.654
+0.147
5.85%
jan 1, 2015
2.789
+0.135
5.07%
jan 1, 2016
3.138
+0.349
12.51%
Ranking of countries by current statistics by years


Comments: